
The One Stock Screen I Would Use for the Rest of My Life
The greatest winning stocks in history rarely begin as laggards. Relative strength helps you find emerging leaders before the crowd realizes they are the stocks institutions are accumulating.
Most traders say they want to own the best stocks. But then they do the exact opposite. They buy the stock that is down 40% because it “looks cheap.” They avoid the stock making new highs because it “already ran.”
They wait for the leader to pull back, then watch it keep going without them. They convince themselves the laggard in the group is the better opportunity because it has “more room to catch up.” That is usually backwards.
The biggest stock market winners rarely begin their major advances from a position of weakness. They usually begin by showing strength before the crowd fully understands why. That is what relative strength helps you see.
Relative strength is one of the most important tools for growth stock and momentum traders because it answers a simple question: Is this stock outperforming the market and most other stocks, or is it just another average name?
For growth stock investors and momentum traders, that question matters more than almost anything else. If there were only one stock screen I could use for the rest of my life, it would be a relative strength stock screen.
Not PE ratios.
Not dividend yield.
Not book value.
Not analyst opinions.
Not news headlines.
Relative strength.
Because the best growth stocks usually reveal themselves through price performance long before the story becomes obvious.
What Relative Strength Actually Measures
Relative strength compares a stock’s price performance against a benchmark and against a universe of other stocks over a defined period of time. The traditional IBD Relative Strength Rating, popularized by William O’Neil, ranks a stock’s price performance over the prior 52 weeks against the rest of the market.
The rating runs from 1 to 99, with 99 being the best. A 99 means the stock has outperformed 99% of the market. A 50 means the stock is basically middle of the pack, with about half the market doing better and half doing worse.
That distinction matters. A stock with a 50 RS Rating is not a leader. It is average, and average is NOT what growth and momentum traders are looking for.
We are looking for stocks that are moving, but not just moving. We are looking for stocks that have the potential to keep moving because institutions are accumulating shares, earnings are accelerating, sales are growing, and the stock is separating itself from the rest of the market.
That is why I generally want to see an RS Rating of 80 or higher, and ideally 90 or higher.
O’Neil’s research supports this. In How to Make Money in Stocks, he wrote that from the early 1950s through 2008, the best-performing stocks had an average RS Rating of 87 before their major run-ups. His conclusion was simple: avoid laggards and do not buy stocks with RS Ratings in the 40s, 50s, or 60s.
That is the part many traders miss. The high RS stock is not automatically “too late.” Many times, high relative strength is the early evidence that a true leader is emerging.
Strong Stocks Usually Look Expensive to Weak Traders

One of the biggest psychological mistakes traders make is assuming strength equals danger. They see a stock with a 90 or 99 RS Rating and immediately think: “It already moved.” “I missed it.” “It has to pull back.” “I should find something cheaper.”
But the market does not reward what feels comfortable.
The market rewards leadership.
O’Neil specifically taught that traders should focus on stocks with RS Ratings of 80 or higher, and that the biggest winners often had RS Ratings of 90 or higher before breaking out of early bases.
One of the biggest concerns I hear from traders who are newer to this style is that a high RS Rating makes them feel like they are already too late. I understand that reaction, but history and real-time market leadership often show the opposite.
Many of the names I highlighted for paid subscribers in the chat or in posts during January and February, including AAOI, AXTI, SNDK, DELL, MU, CIEN, LITE, STRL, WDC, STX, SIMO, VIAV, AMD, INTC, ALAB, and LQDA, already had powerful relative strength ratings at the time, with many ranking 97, 98, or 99.
Yet from January and early February into early June, those names all advanced more than 100%, with many advancing 200%, 300%, or more. That is the point most traders miss. A high RS Rating does not automatically mean the move is over. Many times, it means the stock is beginning to separate itself as a true leader.
That does not mean you chase a stock 20% above a proper pivot. It means you build your watchlist from strength, then wait for a proper setup where risk can be defined. There is a major difference between buying strength and chasing.
Buying strength means you are focused on the best merchandise in the market. Chasing means you are buying too extended without a plan and proper setup, without a stop, and without proper position sizing.
Relative strength helps you find the right stocks. The chart setup, entry, stop, and risk management determine whether the trade is worth taking.
The Standard One-Year Relative Strength ScreenOne of the biggest psychological mistakes traders make is assuming strength equals danger. They see a stock with a 90 or 99 RS Rating and immediately think: “It already moved.” “I missed it.” “It has to pull back.” “I should find something cheaper.”
But the market does not reward what feels comfortable.
The market rewards leadership.
O’Neil specifically taught that traders should focus on stocks with RS Ratings of 80 or higher, and that the biggest winners often had RS Ratings of 90 or higher before breaking out of early bases.
One of the biggest concerns I hear from traders who are newer to this style is that a high RS Rating makes them feel like they are already too late. I understand that reaction, but history and real-time market leadership often show the opposite.
Many of the names I highlighted for paid subscribers in the chat or in posts during January and February, including AAOI, AXTI, SNDK, DELL, MU, CIEN, LITE, STRL, WDC, STX, SIMO, VIAV, AMD, INTC, ALAB, and LQDA, already had powerful relative strength ratings at the time, with many ranking 97, 98, or 99.
Yet from January and early February into early June, those names all advanced more than 100%, with many advancing 200%, 300%, or more. That is the point most traders miss. A high RS Rating does not automatically mean the move is over. Many times, it means the stock is beginning to separate itself as a true leader.
That does not mean you chase a stock 20% above a proper pivot. It means you build your watchlist from strength, then wait for a proper setup where risk can be defined. There is a major difference between buying strength and chasing.
Buying strength means you are focused on the best merchandise in the market. Chasing means you are buying too extended without a plan and proper setup, without a stop, and without proper position sizing.
Relative strength helps you find the right stocks. The chart setup, entry, stop, and risk management determine whether the trade is worth taking.
The Standard One-Year Relative Strength Screen
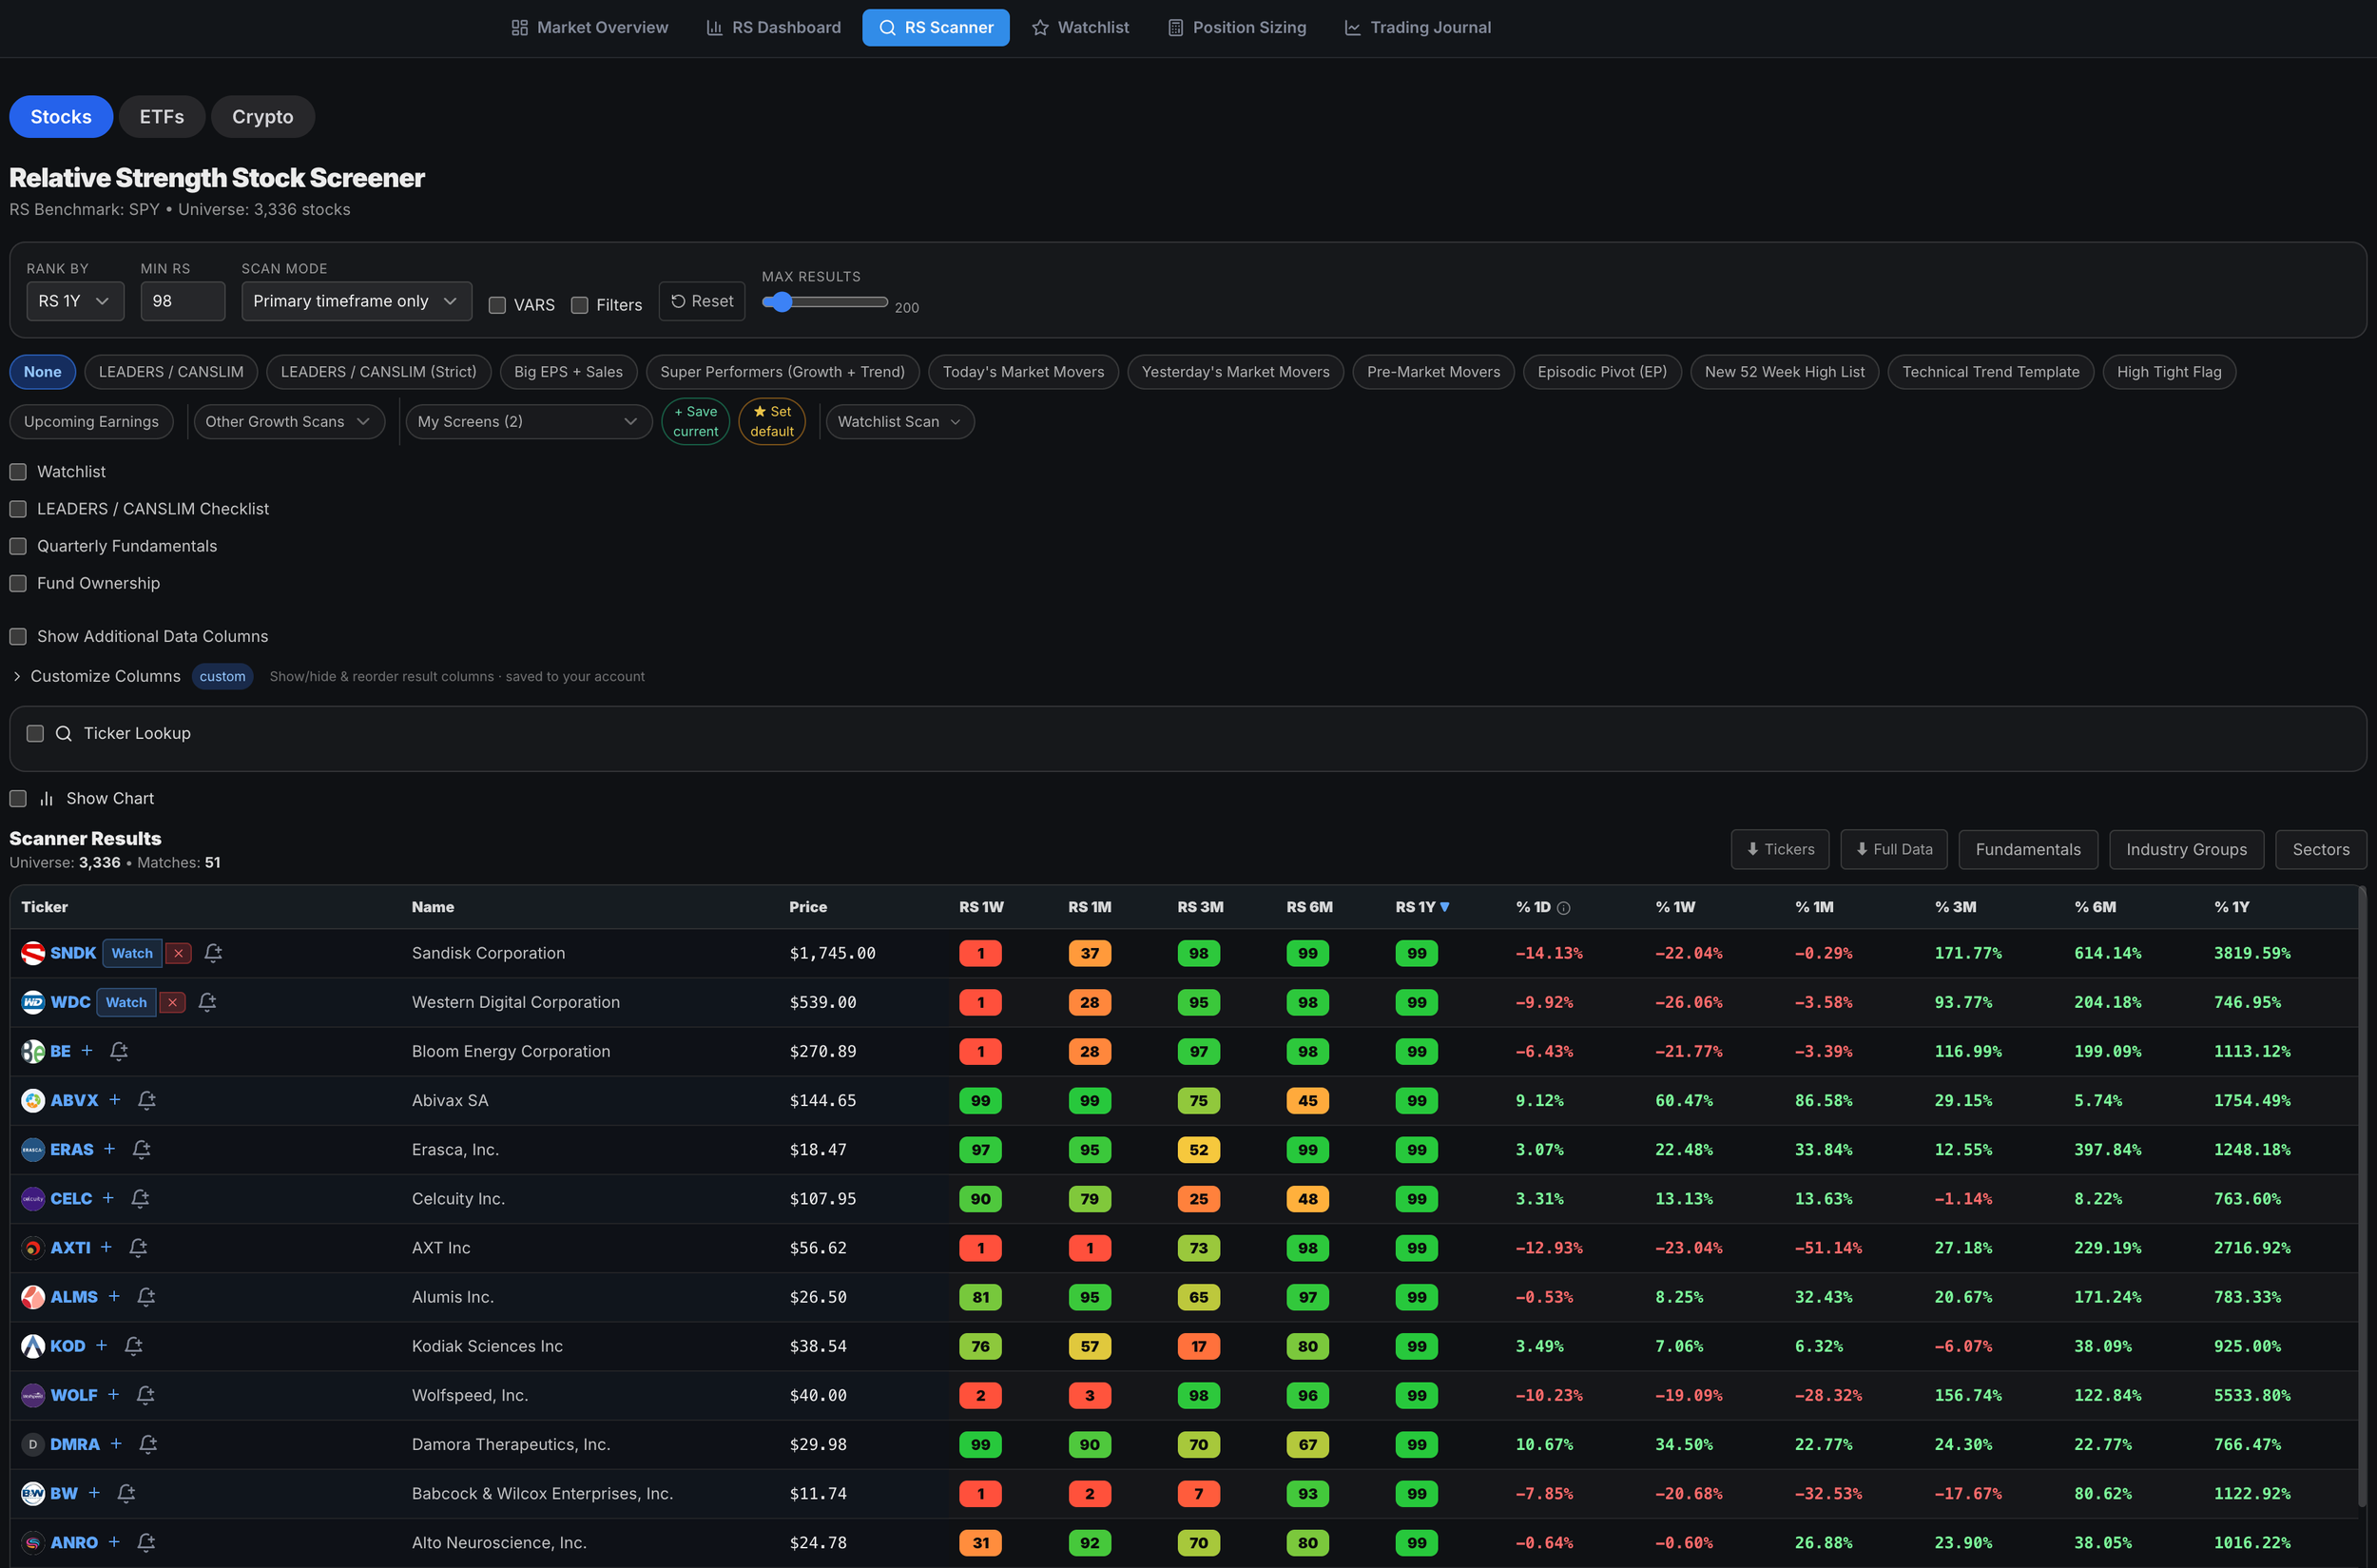
The classic approach is the one-year RS Rating. This is the standard method associated with IBD and William O’Neil. It looks at price performance over roughly the past 12 months and ranks each stock against the broader stock universe.
For growth stock and momentum traders, a simple starting point is an RS Rating of 80 or higher, preferably 90 or higher, with the strongest leaders often ranking between 95 and 99.
This type of screen helps you quickly remove the dead money. You are not trying to find every stock that can go up. Almost anything can bounce. You are trying to find the names that are already proving they are better than the market.
This matters for both position traders and swing traders. Some of my best longer-term position trades started with strong one-year relative strength, but many of my best shorter-term swing trades did too.
The one-year RS Rating may sound like a slower tool, but in practice it often does an excellent job identifying the stocks institutions care about most. A powerful stock can have a high one-year RS Rating and still be in the early stages of a much larger move.
That is the part amateurs struggle to understand.
They think high RS means the opportunity is gone.
Many times, high RS is the first clue that the opportunity is real.
Shorter-Term Relative Strength: One Month, Three Months, and Six MonthsThe classic approach is the one-year RS Rating. This is the standard method associated with IBD and William O’Neil. It looks at price performance over roughly the past 12 months and ranks each stock against the broader stock universe.
For growth stock and momentum traders, a simple starting point is an RS Rating of 80 or higher, preferably 90 or higher, with the strongest leaders often ranking between 95 and 99.
This type of screen helps you quickly remove the dead money. You are not trying to find every stock that can go up. Almost anything can bounce. You are trying to find the names that are already proving they are better than the market.
This matters for both position traders and swing traders. Some of my best longer-term position trades started with strong one-year relative strength, but many of my best shorter-term swing trades did too.
The one-year RS Rating may sound like a slower tool, but in practice it often does an excellent job identifying the stocks institutions care about most. A powerful stock can have a high one-year RS Rating and still be in the early stages of a much larger move.
That is the part amateurs struggle to understand.
They think high RS means the opportunity is gone.
Many times, high RS is the first clue that the opportunity is real.
Shorter-Term Relative Strength: One Month, Three Months, and Six MonthsThe classic approach is the one-year RS Rating. This is the standard method associated with IBD and William O’Neil. It looks at price performance over roughly the past 12 months and ranks each stock against the broader stock universe.
For growth stock and momentum traders, a simple starting point is an RS Rating of 80 or higher, preferably 90 or higher, with the strongest leaders often ranking between 95 and 99.
This type of screen helps you quickly remove the dead money. You are not trying to find every stock that can go up. Almost anything can bounce. You are trying to find the names that are already proving they are better than the market.
This matters for both position traders and swing traders. Some of my best longer-term position trades started with strong one-year relative strength, but many of my best shorter-term swing trades did too.
The one-year RS Rating may sound like a slower tool, but in practice it often does an excellent job identifying the stocks institutions care about most. A powerful stock can have a high one-year RS Rating and still be in the early stages of a much larger move.
That is the part amateurs struggle to understand.
They think high RS means the opportunity is gone.
Many times, high RS is the first clue that the opportunity is real.
Shorter-Term Relative Strength: One Month, Three Months, and Six Months
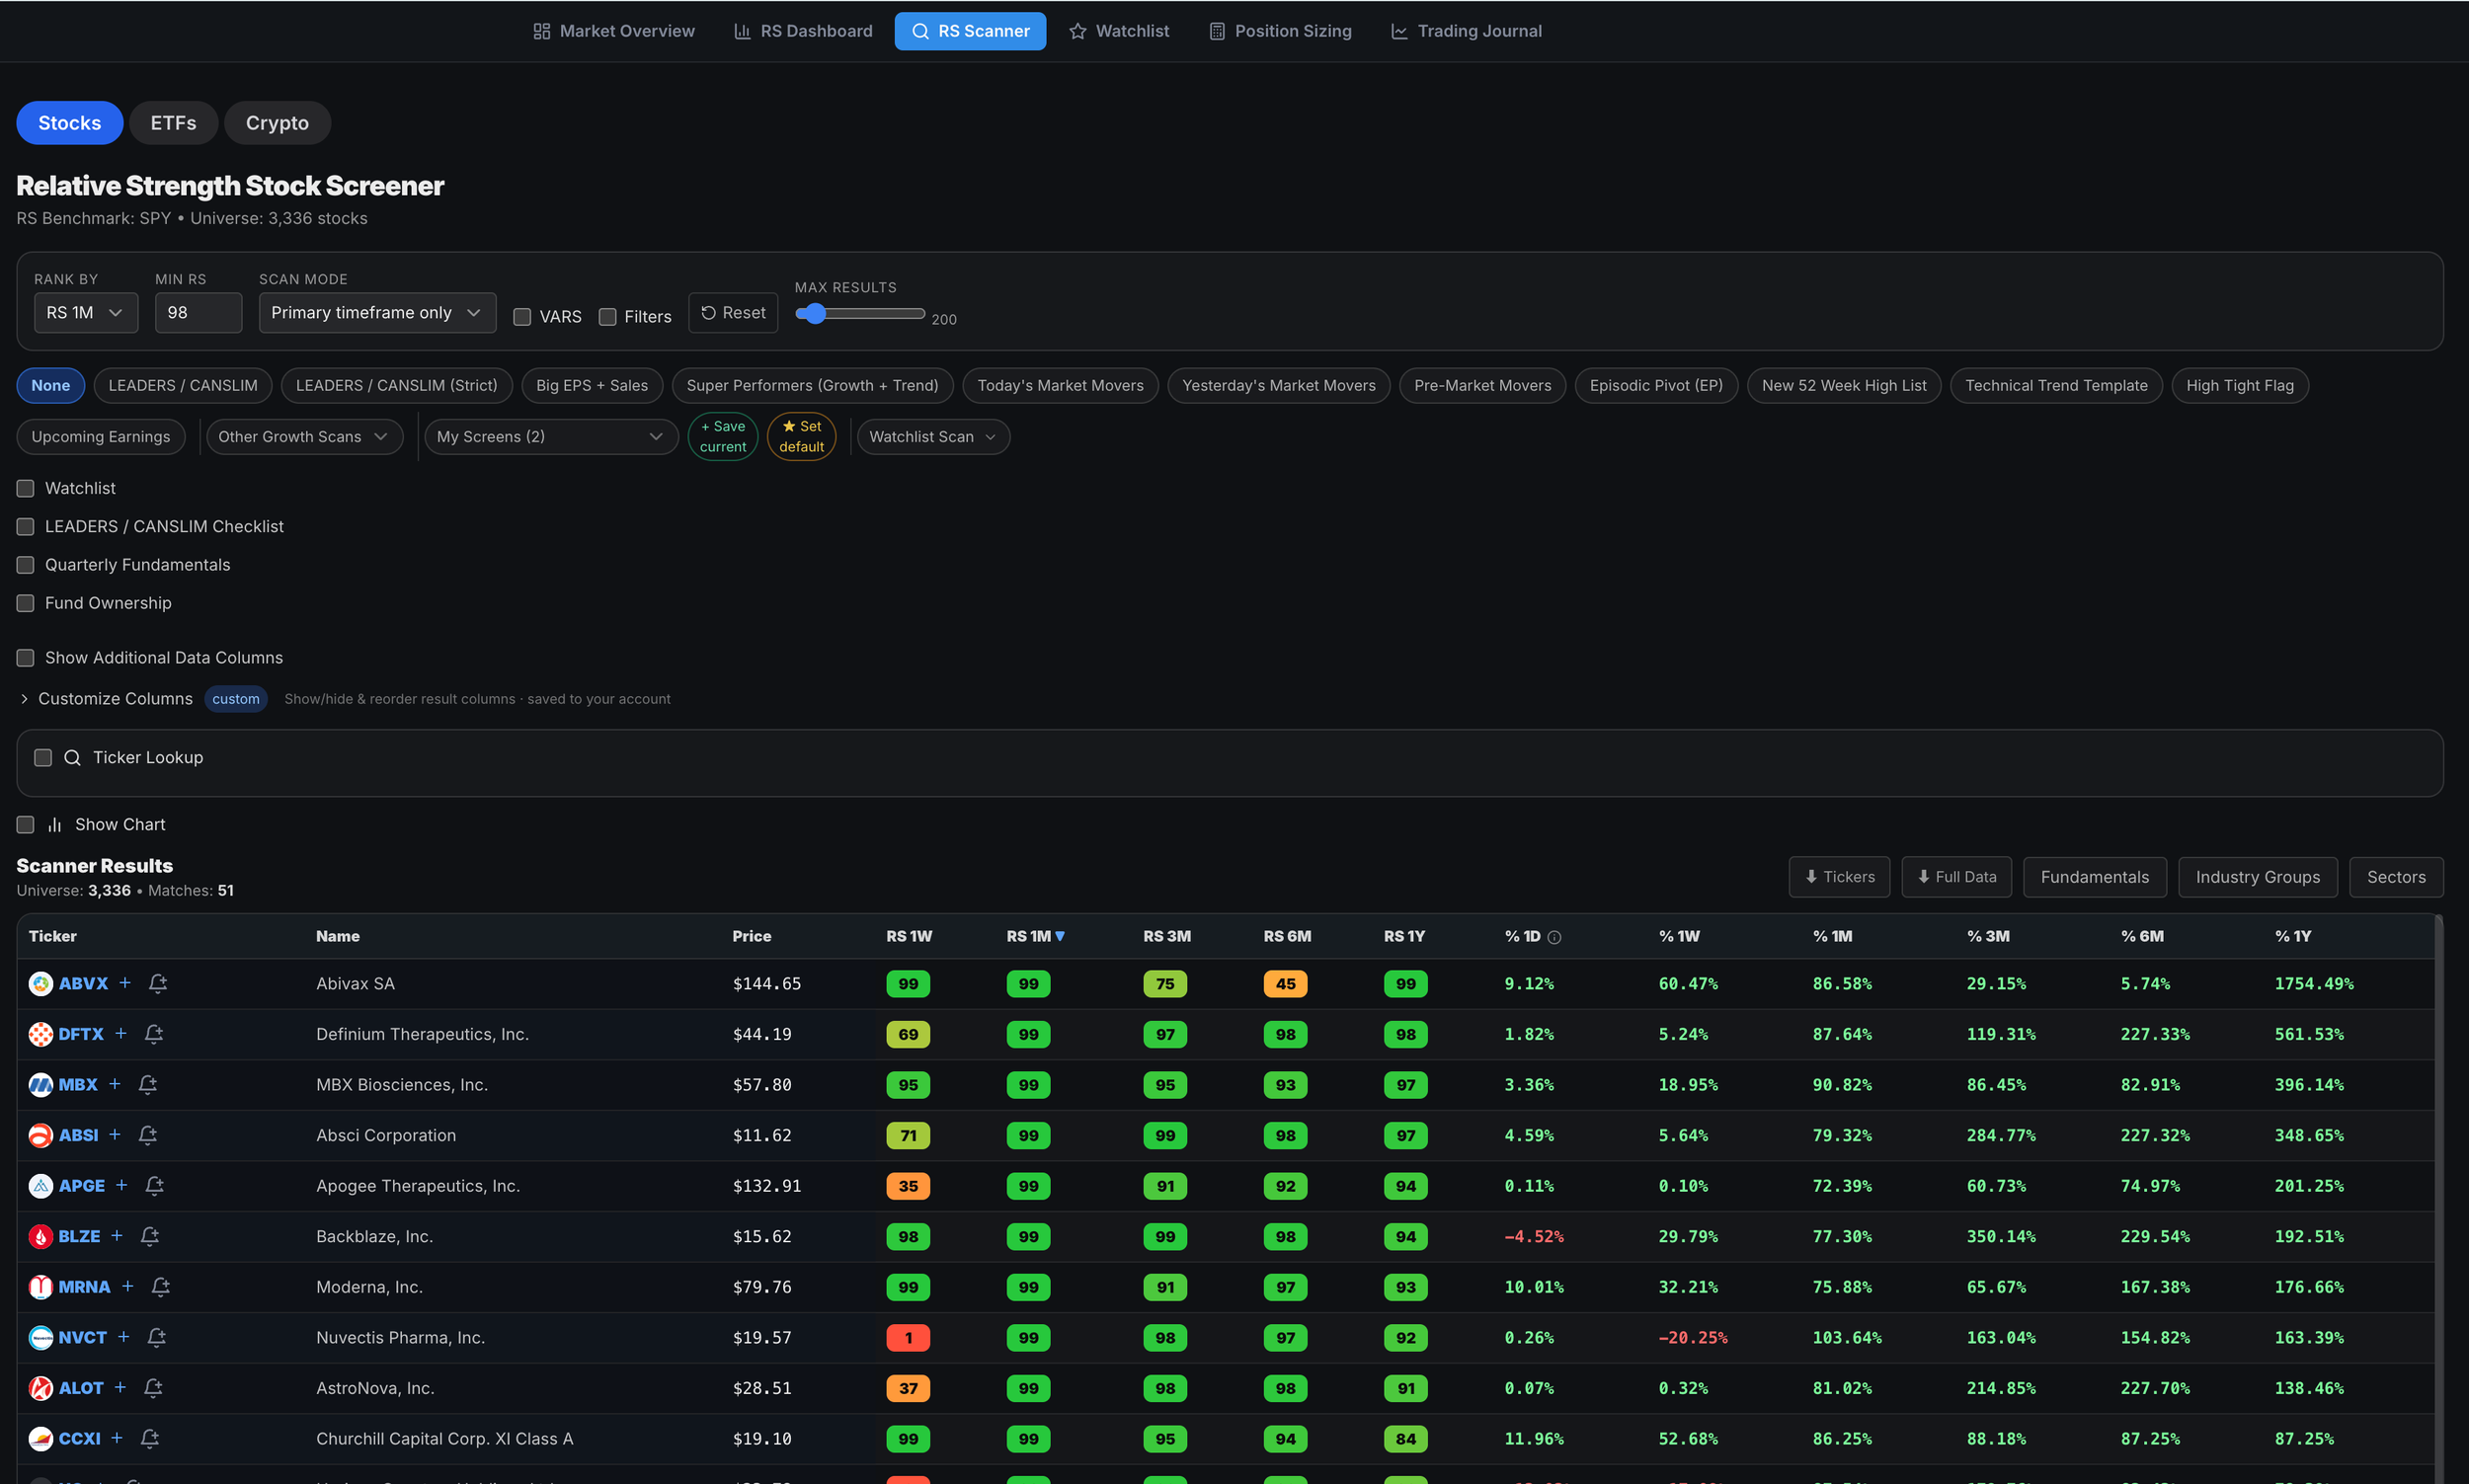
The one-year RS Rating is not the only way to use relative strength. Shorter-term traders may want to look at relative strength over one-month, three-month, and six-month time frames. This can be especially useful for swing traders, traders focused on fresh momentum, or traders looking for newer leadership that has not yet built a long one-year record.
For example, you can scan for stocks with a one-month RS of 98 or higher, a three-month RS of 98 or higher, and a six-month RS of 98 or higher. This is similar in spirit to what momentum traders like Kristjan Kullamägi look for when studying the top 1% or 2% of stocks over specific time frames. Kullamägi has also spoken in videos and interviews about the importance of high relative strength and the influence How to Make Money in Stocks had on his development as a trader.
The benefit is simple. You are not waiting for an opinion. You are not guessing where money might go.
You are looking at where money is already going.
Short-term relative strength can help you find explosive names earlier, especially after market corrections, sector rotations, or new industry themes.
Multiple-Time-Frame Relative Strength
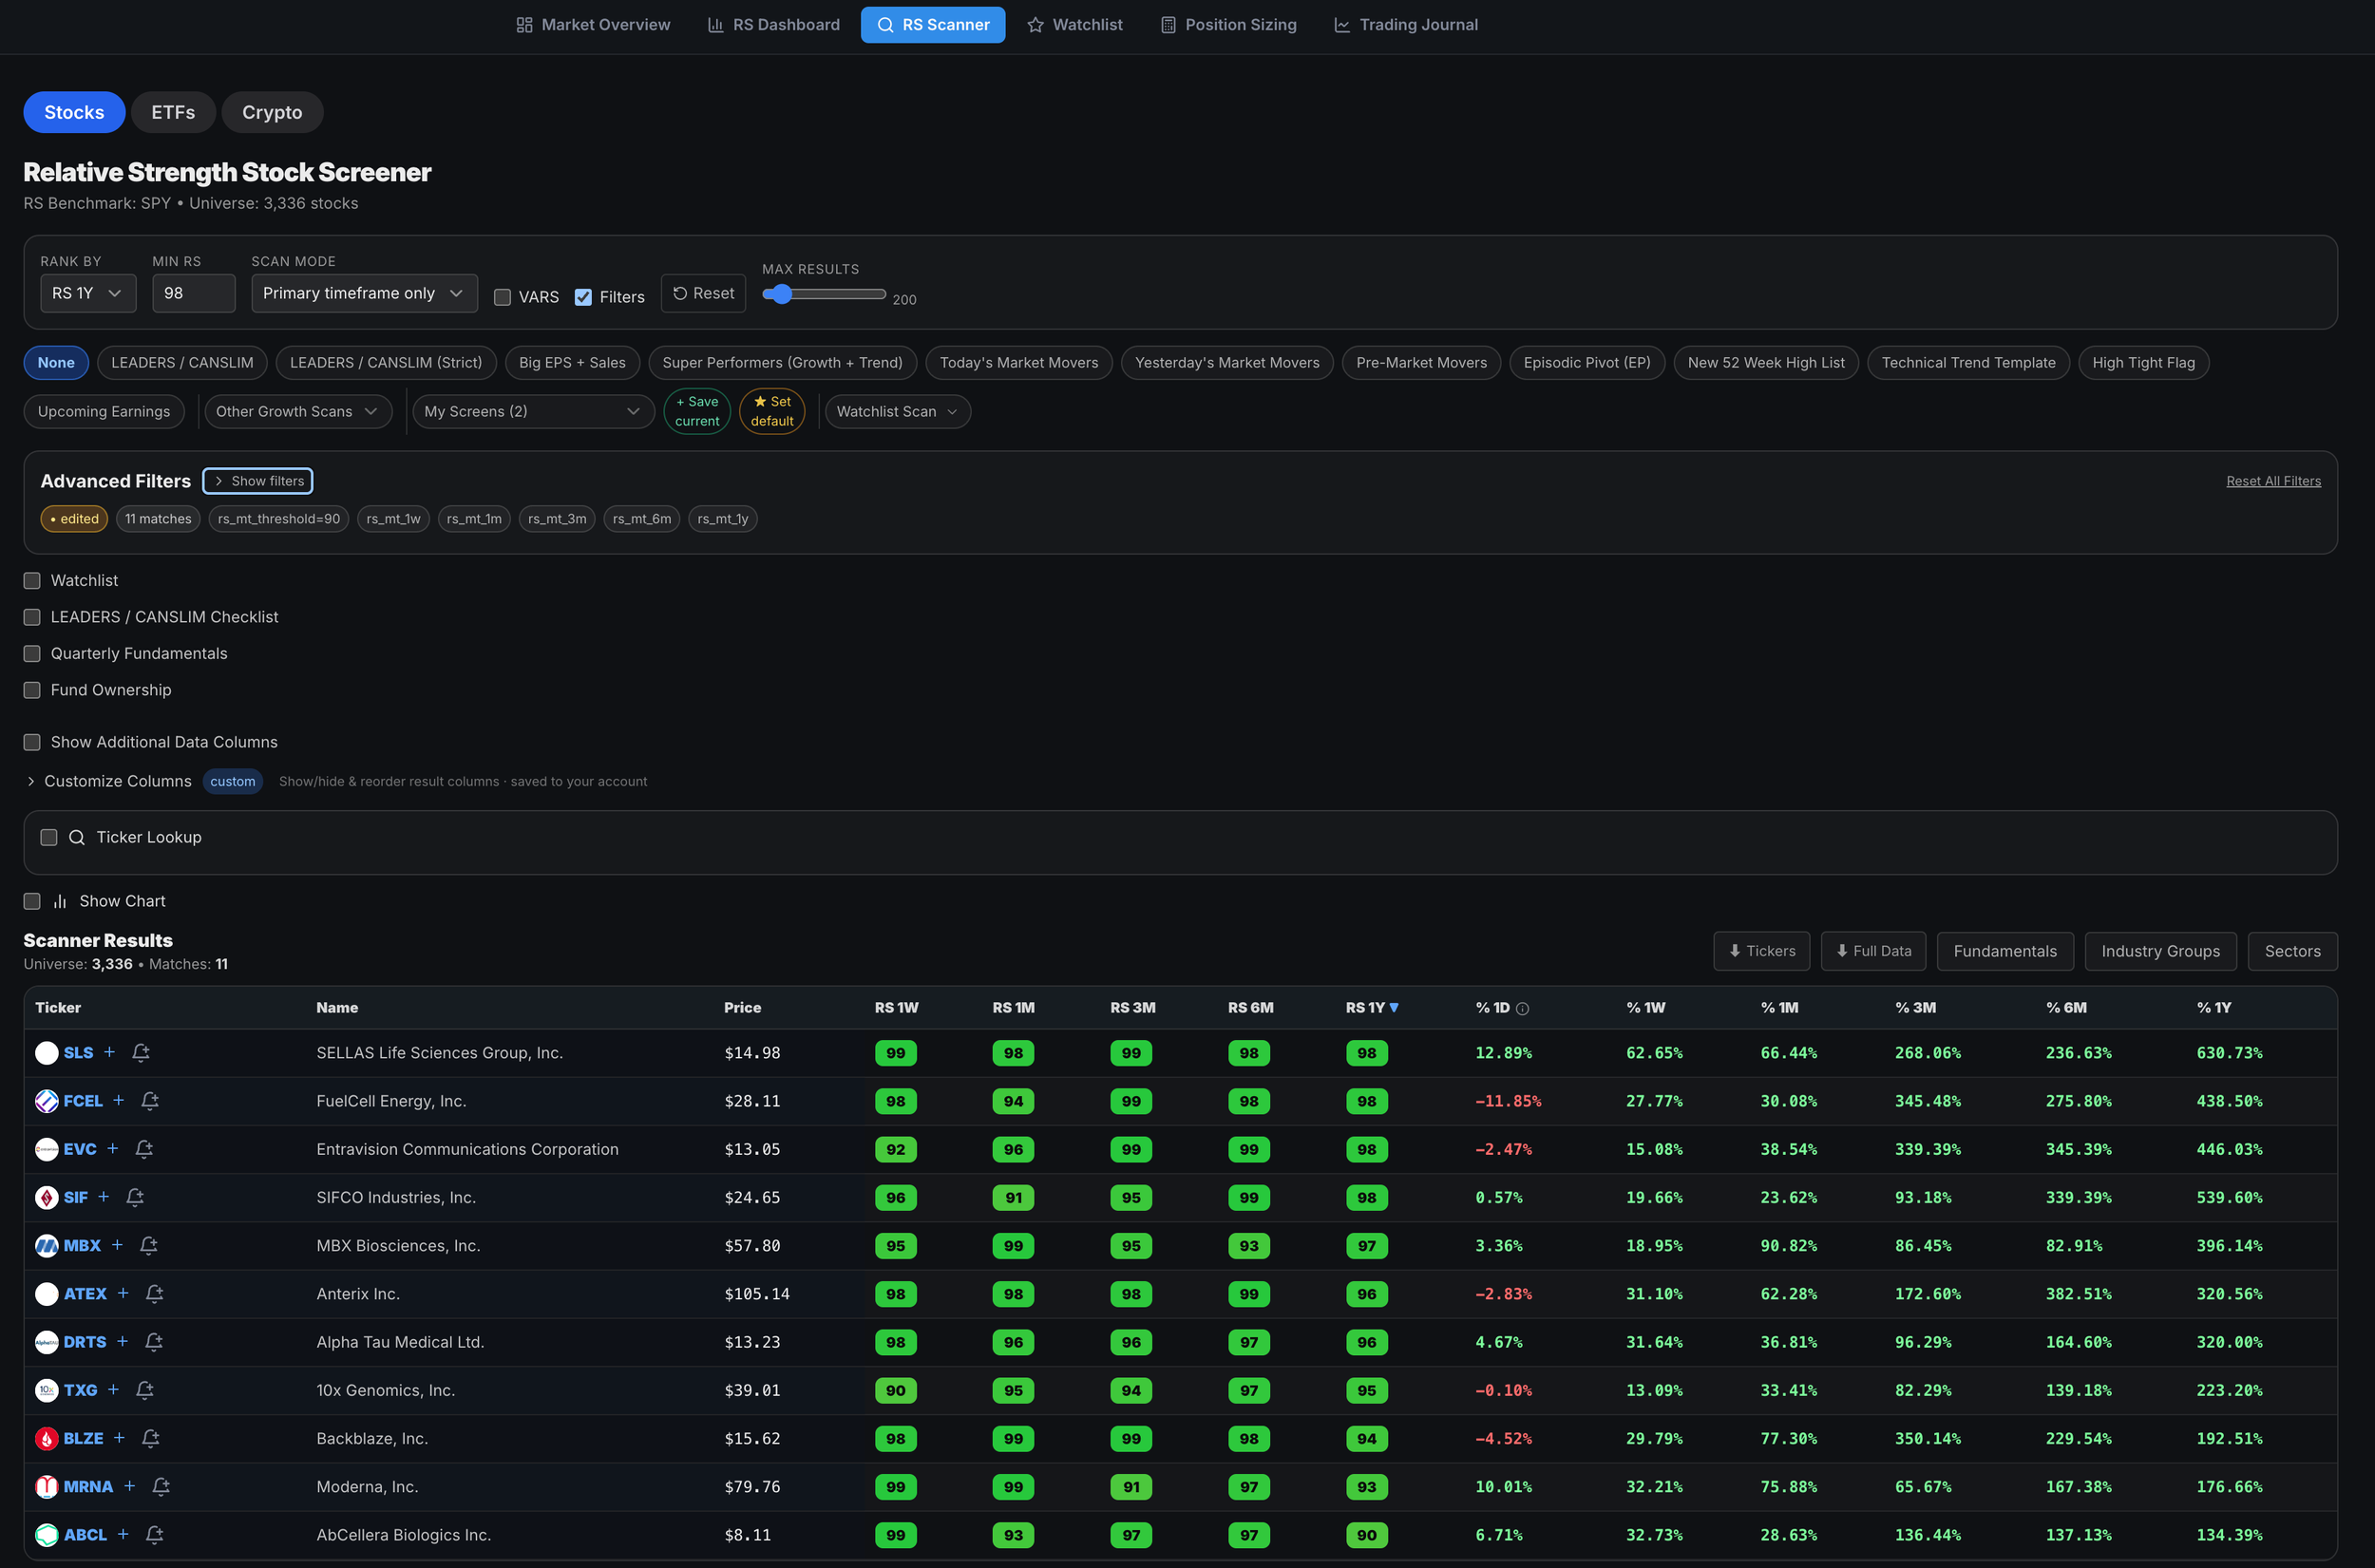
Another powerful way to use relative strength is across multiple time frames. A stock with strong one-month RS may simply be bouncing from weakness. A stock with strong one-month, three-month, six-month, and one-year RS is showing something more durable.
That does not guarantee it will keep working. Nothing does. But it tells you the stock is not just having a one-week pop. It is showing persistent leadership across multiple time frames.
That is the kind of stock I want to study.
A multiple-time-frame RS screen might look for one-month RS above 80, three-month RS above 80, six-month RS above 80, and one-year RS above 80. For a more aggressive screen, you might raise those minimums to 90 or higher across each time frame.
The stricter the screen, the smaller the list. That is a good thing. A good stock screener should not give you 800 names to review. It should help you narrow the market down to a focused list of potential leaders.
Short-Term Relative Strength Pullbacks Can Create Opportunity
A decline in shorter-term relative strength does not always mean a stock is losing leadership. Sometimes it simply means the stock is pulling back, digesting a prior advance, or giving traders a potential entry opportunity while the longer-term trend remains intact.
This is where multiple-time-frame relative strength becomes useful. A stock may still have powerful three-month, six-month, or one-year relative strength, but its one-week or one-month relative strength may weaken during a normal pullback. That short-term weakness can look like deceleration at first, but the chart may tell a different story.
The key is to study the price action. Is the stock still making higher highs and higher lows? Is it holding above the 20-day, 50-day, or another key moving average? Is the pullback happening on lighter volume, or is there heavy selling and clear institutional distribution?
Many great leaders will see short-term relative strength cool off during normal pullbacks. For example, while the general market may be breaking below its 50-day or 200-day moving average, a true leader may only be pulling back to its 20-day. In that case, the shorter-term RS may decline, but the stock is still holding up far better than the market.
That can be a sign of quiet strength. Money may be temporarily rotating elsewhere, or the stock may simply be consolidating before its next move. When the market firms up again, or when demand returns to the group, that same stock may quickly regain relative strength.
This is where there is both art and science to using relative strength. A short-term RS decline can give you an early warning that a stock is breaking down, but it can also alert you to a potential pullback setup. The difference comes from combining relative strength with chart structure, volume, moving averages, and risk management.
Relative Strength Acceleration
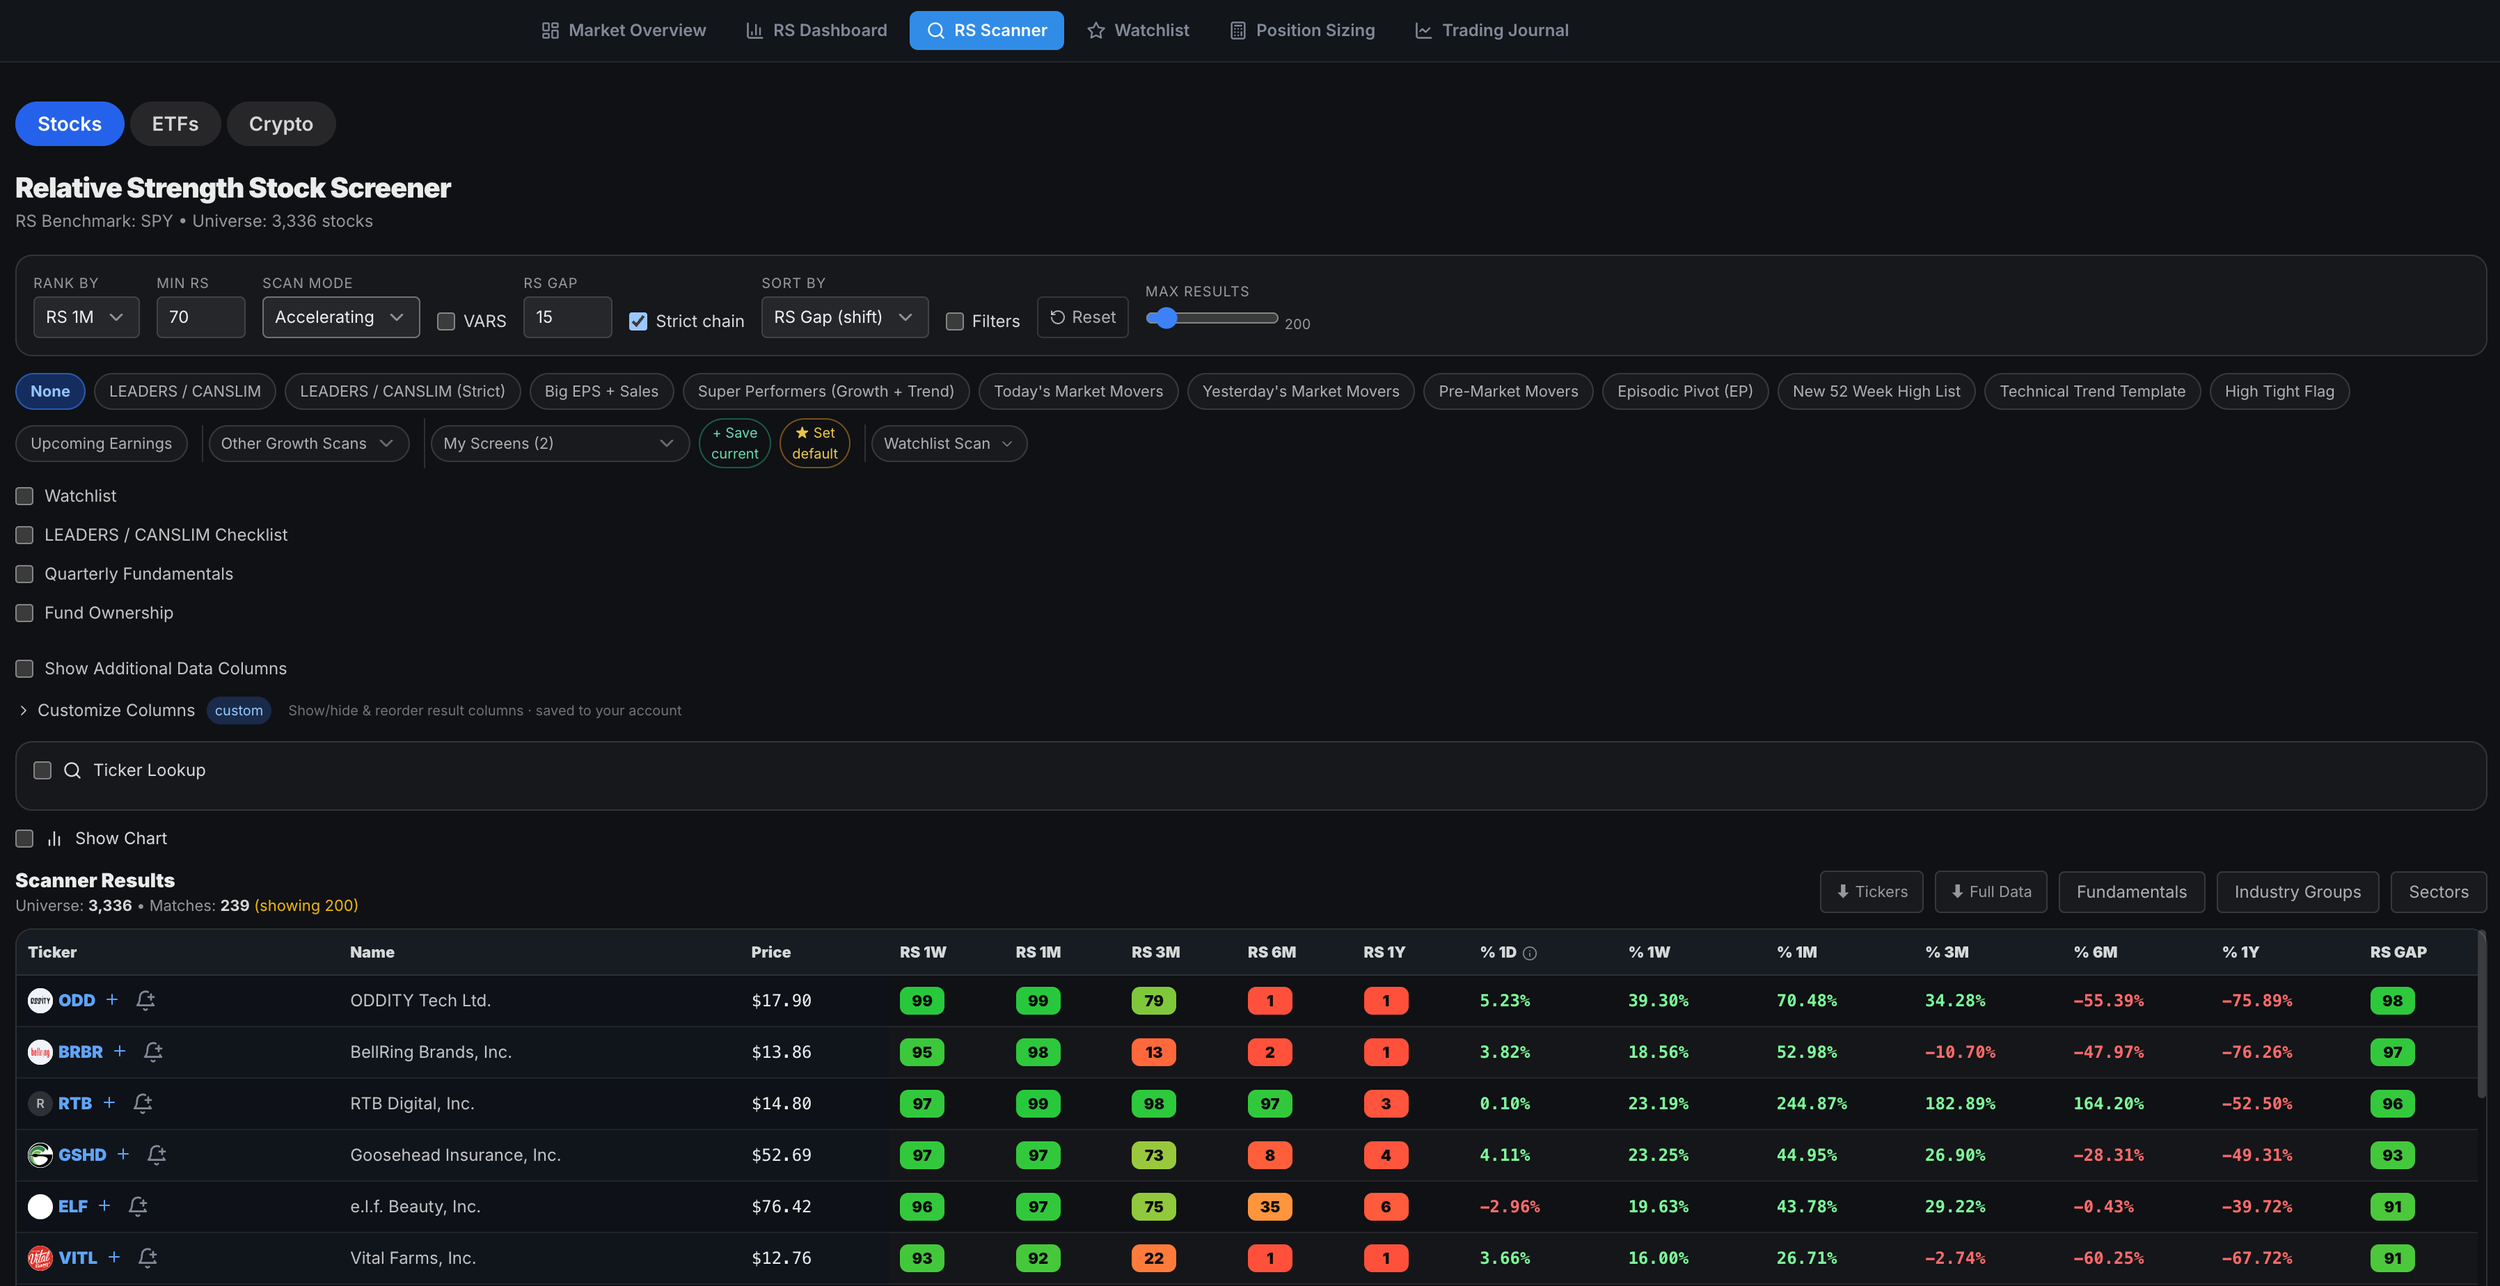
Relative strength can also help you find stocks that are gaining momentum. This is one of my favorite ways to use it. Instead of only asking, “What has been strong for the last year?” you can ask a better question.
What is getting stronger right now?
For example, a stock may have an ok one-year RS Rating but a very strong one-month or three-month RS Rating. That tells you something may be changing. Maybe the company reported a major earnings surprise. Maybe sales growth is accelerating.
Maybe a new industry theme is emerging. Maybe institutions are starting to build positions. Maybe the stock is moving from laggard to leader.
This is where acceleration matters. A stock that moves from weak relative strength to strong short-term relative strength may be in the early stages of a new leadership phase. That does not mean you blindly buy it.
It means you put it on your watchlist and study the chart. Is it breaking out? Is volume coming in? Is it holding key moving averages? Is it building a proper base? Is the industry group improving? Are earnings and sales supporting the move?
Relative Strength Deceleration
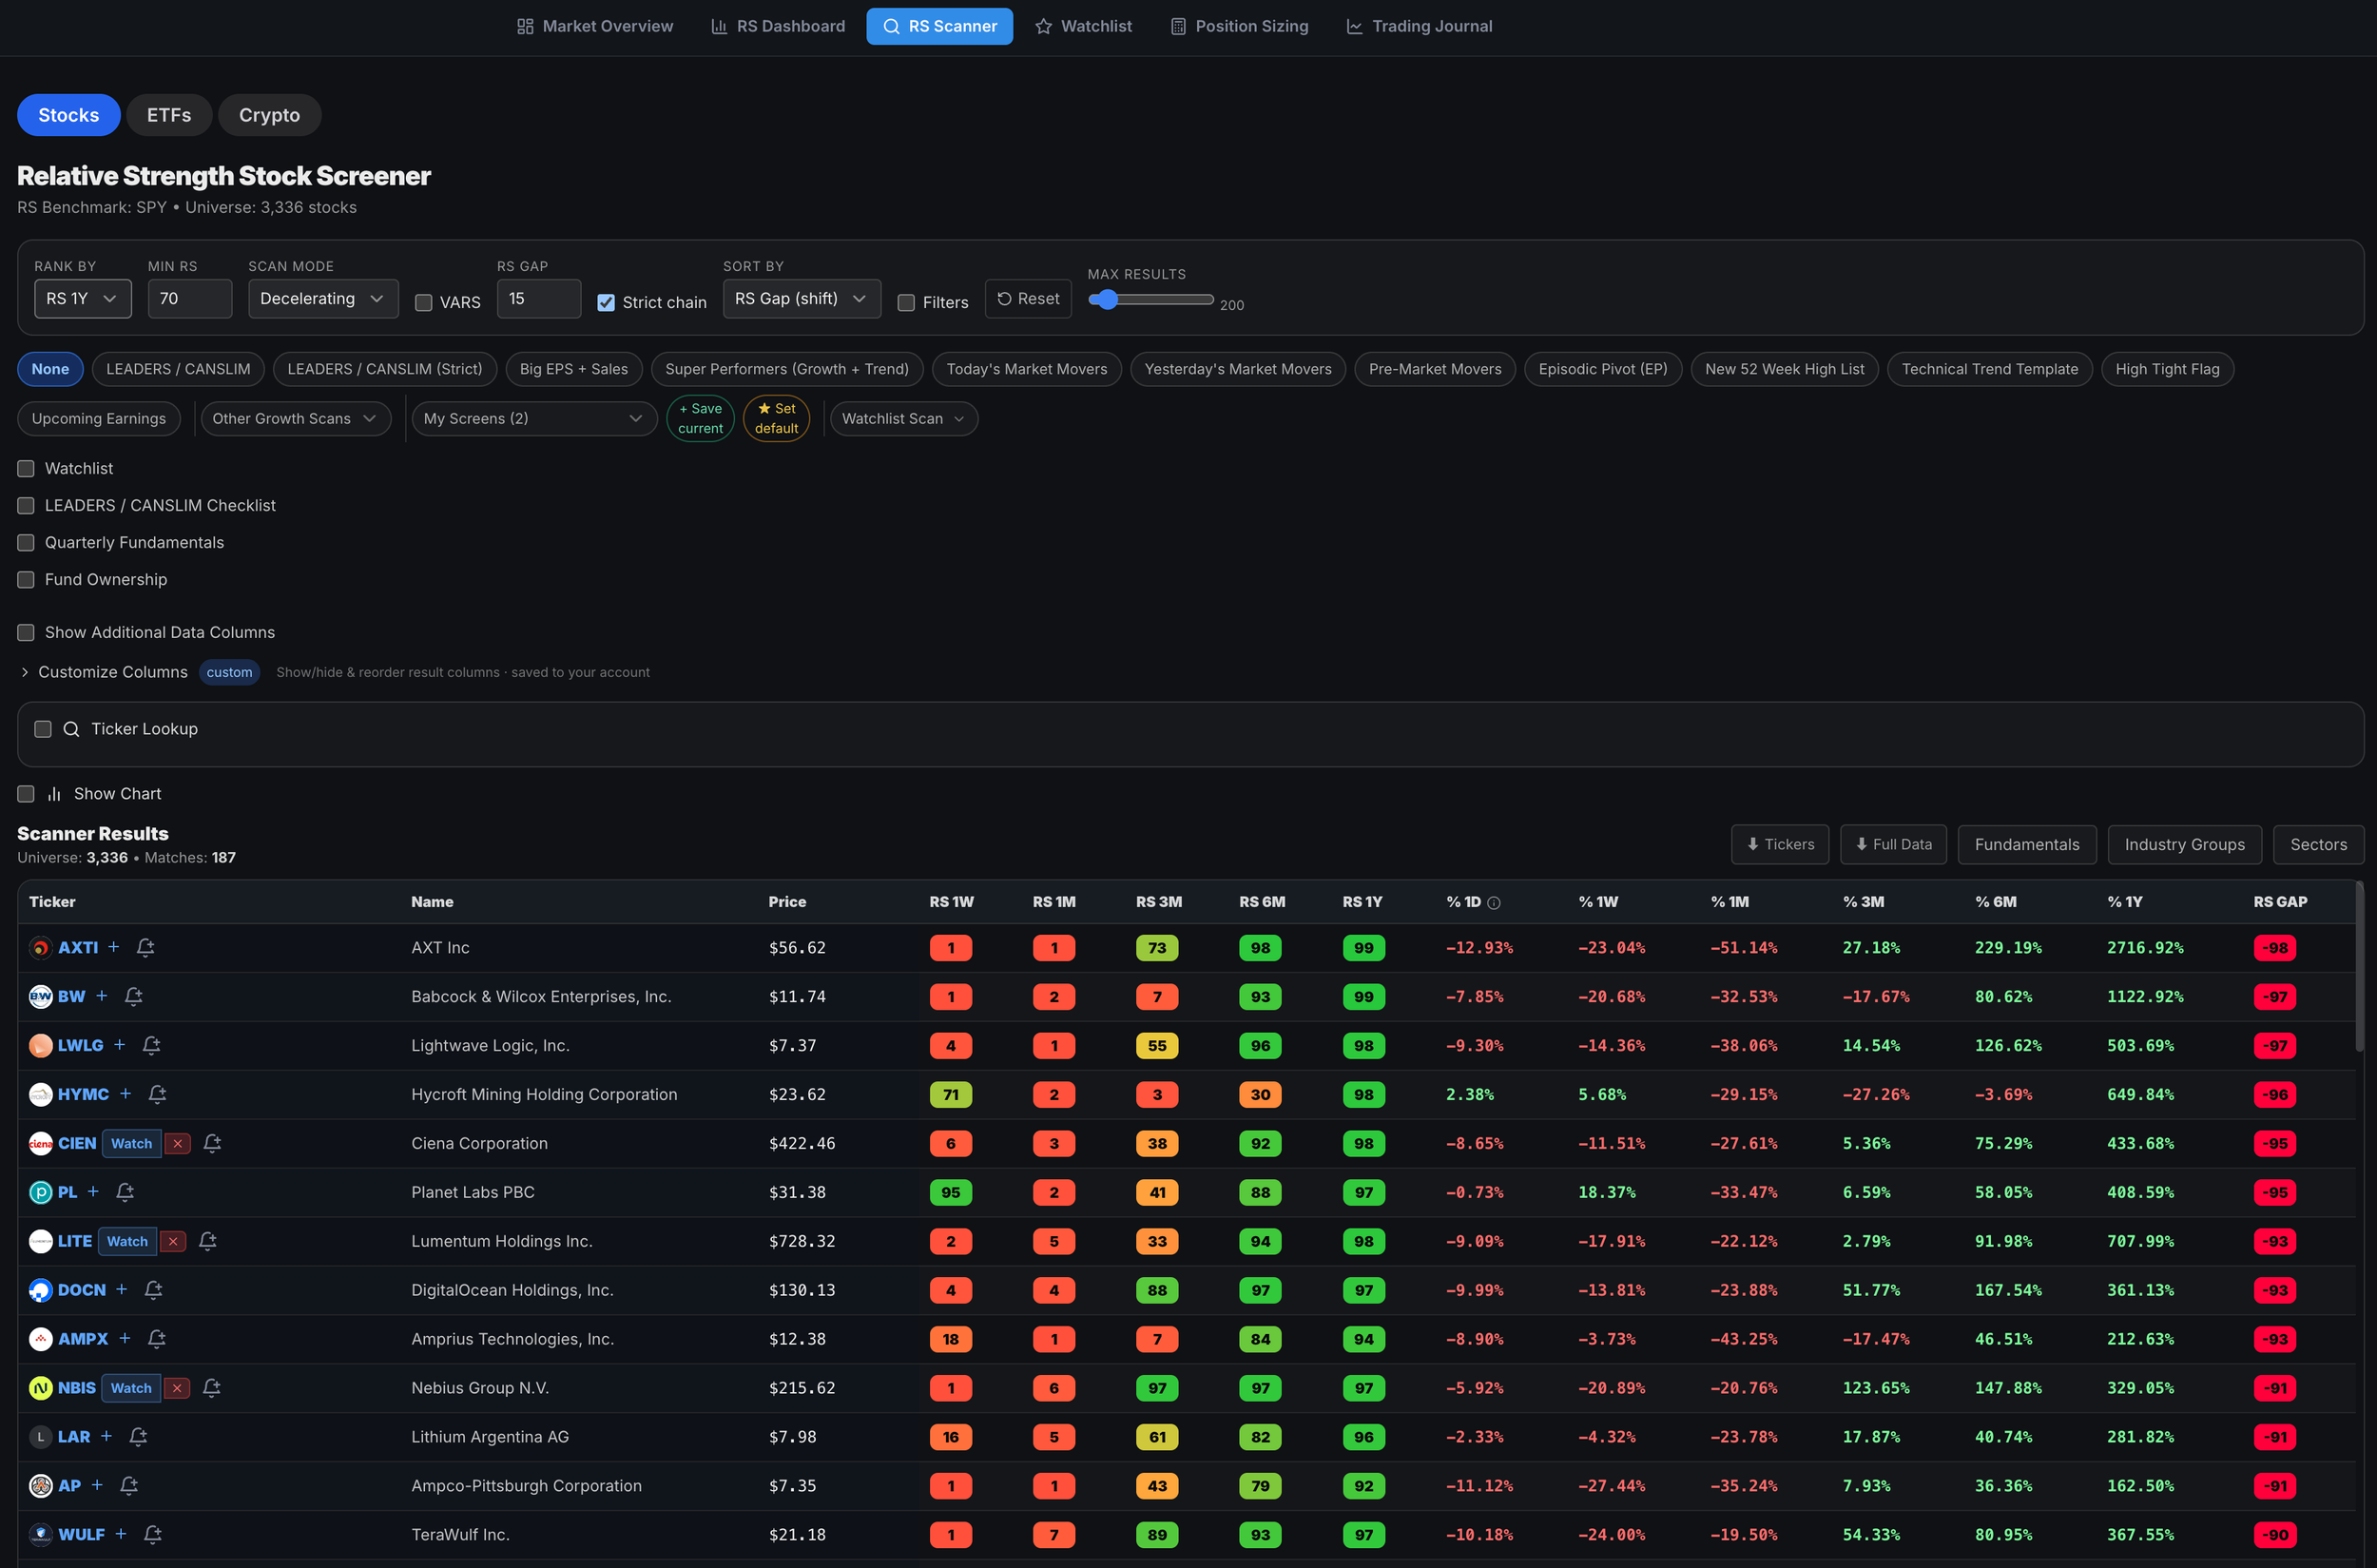
Relative strength is not only useful for finding leaders. It is also useful for spotting when former leaders are losing leadership. This is one of the most underrated uses of relative strength.
A stock can be a monster winner for months and then slowly begin to lose momentum before the real damage becomes obvious on the chart. That is where deceleration matters. When a former leader starts losing relative strength, especially across shorter-term time frames, it is often a warning that institutions are no longer supporting it the same way.
The stock may still look fine to people who only look at the long-term chart. But underneath the surface, leadership may already be fading. This is why traders must avoid falling in love with names.
A stock does not care that it made you money. A leader can become a laggard. A strong industry group can rotate out of favor. A beautiful uptrend can break down.
Relative strength deceleration helps you see when the evidence is changing. That does not mean every dip is a sell signal. Strong stocks pull back. Leaders shake people out. Normal corrections are part of the process.
But when RS begins to weaken, the stock breaks below key moving averages, the 10-day and 20-day roll below the 50-day, lower lows appear, and the stock stops responding to good news, you should pay attention.
The stock is telling you something.
Relative Strength Alone Is Powerful, But It Gets Better With FundamentalsRelative strength is not only useful for finding leaders. It is also useful for spotting when former leaders are losing leadership. This is one of the most underrated uses of relative strength.
A stock can be a monster winner for months and then slowly begin to lose momentum before the real damage becomes obvious on the chart. That is where deceleration matters. When a former leader starts losing relative strength, especially across shorter-term time frames, it is often a warning that institutions are no longer supporting it the same way.
The stock may still look fine to people who only look at the long-term chart. But underneath the surface, leadership may already be fading. This is why traders must avoid falling in love with names.
A stock does not care that it made you money. A leader can become a laggard. A strong industry group can rotate out of favor. A beautiful uptrend can break down.
Relative strength deceleration helps you see when the evidence is changing. That does not mean every dip is a sell signal. Strong stocks pull back. Leaders shake people out. Normal corrections are part of the process.
But when RS begins to weaken, the stock breaks below key moving averages, the 10-day and 20-day roll below the 50-day, lower lows appear, and the stock stops responding to good news, you should pay attention.
The stock is telling you something.
Relative Strength Alone Is Powerful, But It Gets Better With Fundamentals
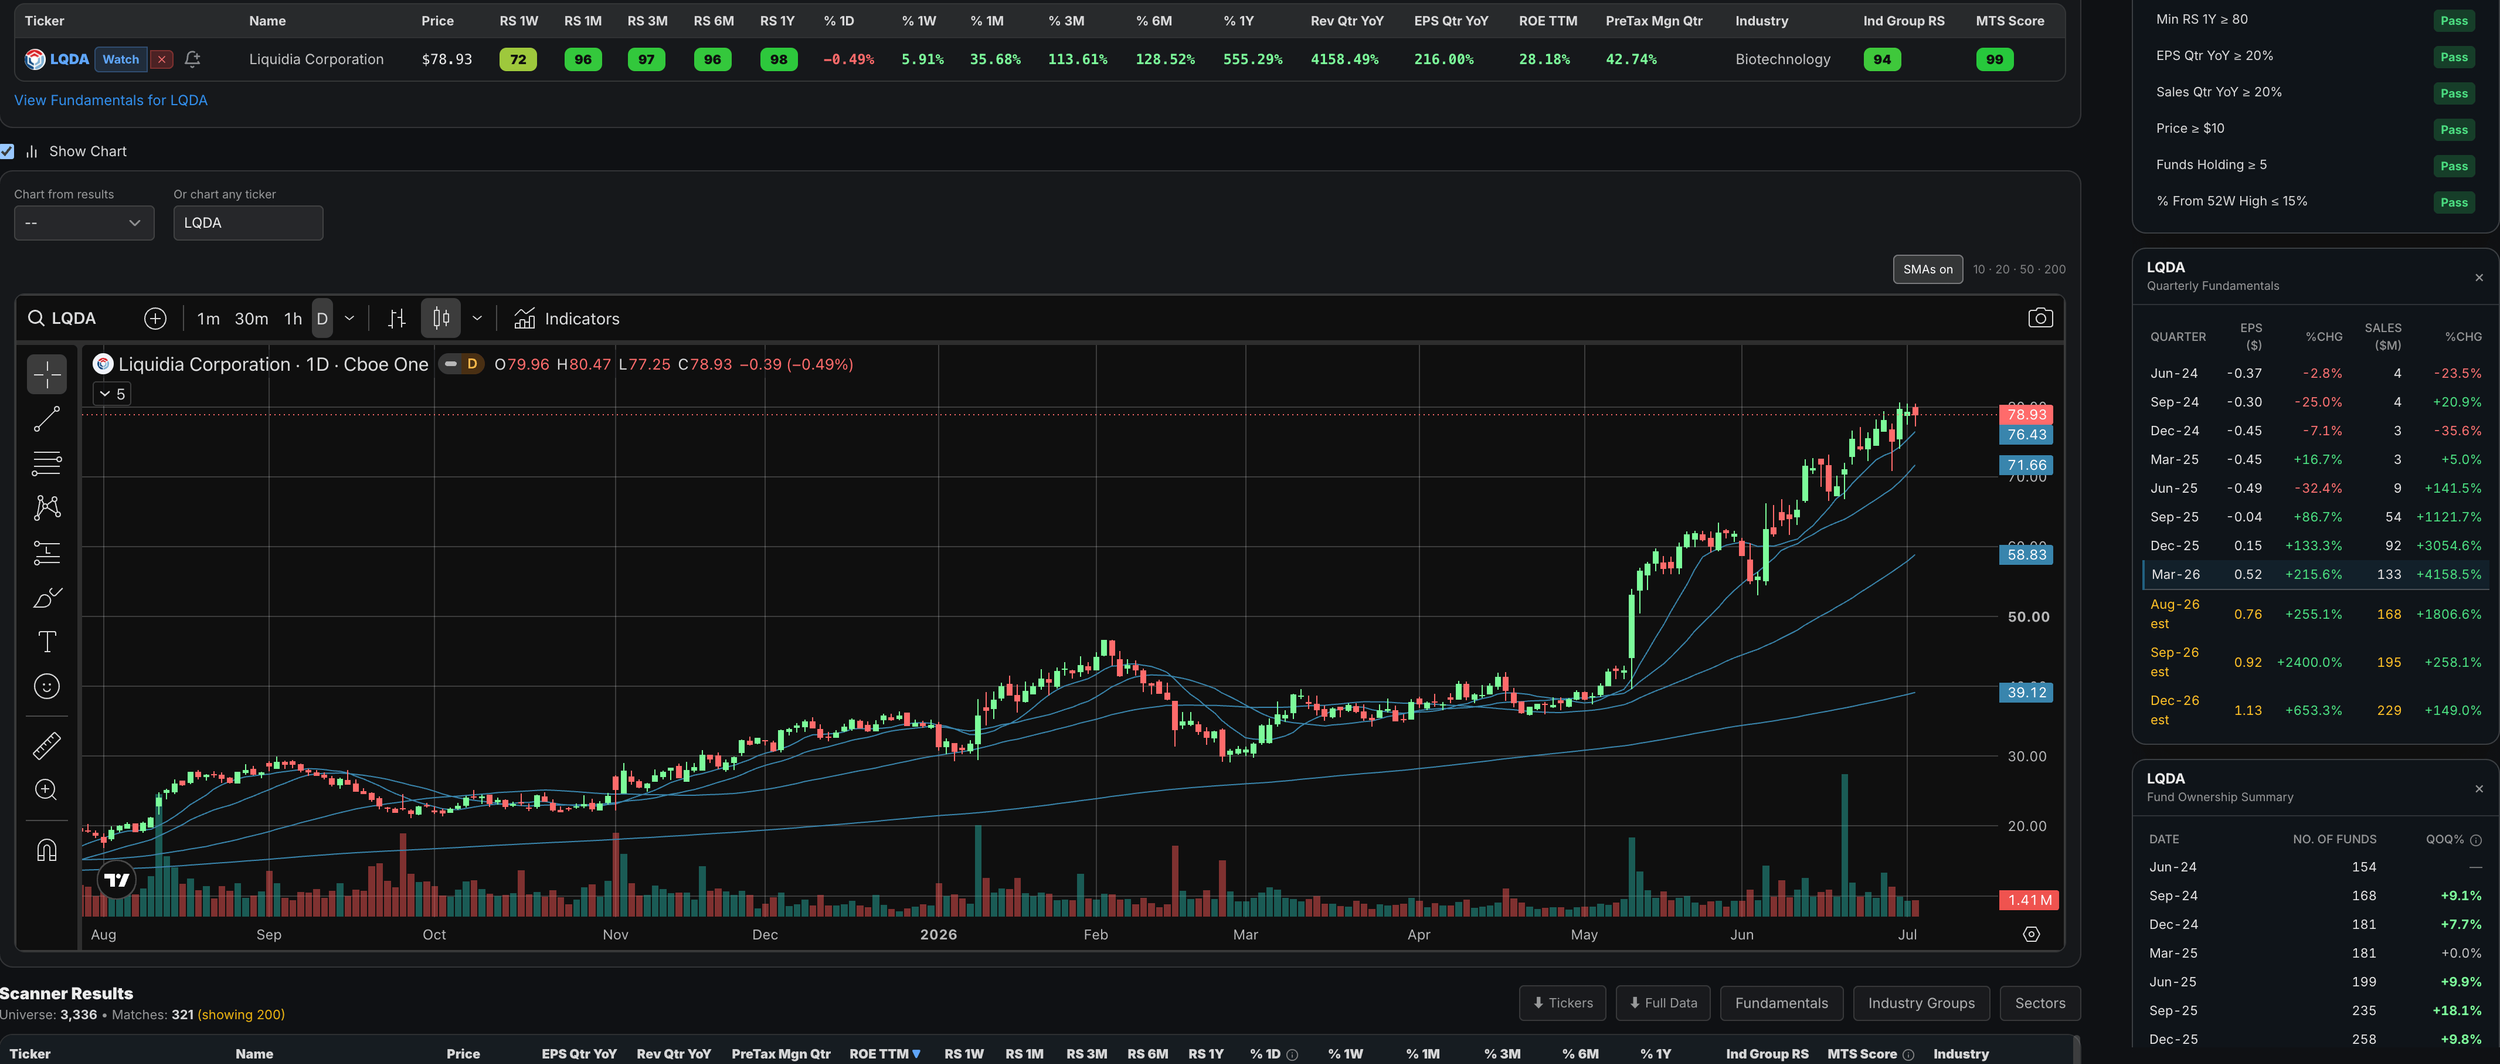
You can find enormous success by starting with relative strength, but I do not stop there. Once I have a strong RS list, I want to narrow it down further.
The goal is not just to find stocks that are moving. The goal is to find stocks with the characteristics of true market leaders. That means I want to see big earnings growth, big sales growth, strong return on equity or strong pre-tax margins, preferably both, a leading industry group, increasing fund ownership quarter over quarter, price near new 52-week highs, and a proper chart setup where risk can be clearly defined.
This is where relative strength connects directly with the CAN SLIM philosophy. O’Neil emphasized current quarterly earnings growth, annual earnings growth, new products/services or new price highs, supply and demand, leadership, institutional sponsorship, and market direction as the core parts of CAN SLIM.
Relative strength helps identify the “L” in CAN SLIM: leader or laggard. But the best opportunities often come when the “L” is supported by the rest of the equation.
Strong RS plus strong earnings.
Strong RS plus strong sales.
Strong RS plus strong margins.
Strong RS plus strong fund sponsorship.
Strong RS plus a leading industry group.
Strong RS plus a proper chart setups.
That is when a stock becomes worth serious attention.
If you are new to trading, I cover many of these chart setups in Modules 4 and 5 of the Momentum Trading Strategy Course, including how to identify proper entry areas, define risk, and avoid chasing extended stocks.
O’Neil also wrote that using both strong EPS and strong RS ratings can materially improve the stock selection process in positive markets, with many superior stocks ranking 80 or higher on both before their major moves.
That is exactly how I think about screening. Relative strength gives me the first cut. Fundamentals, industry group strength, ownership trends, and chart structure help me separate the real leaders from the temporary movers.
Industry Group Strength Matters
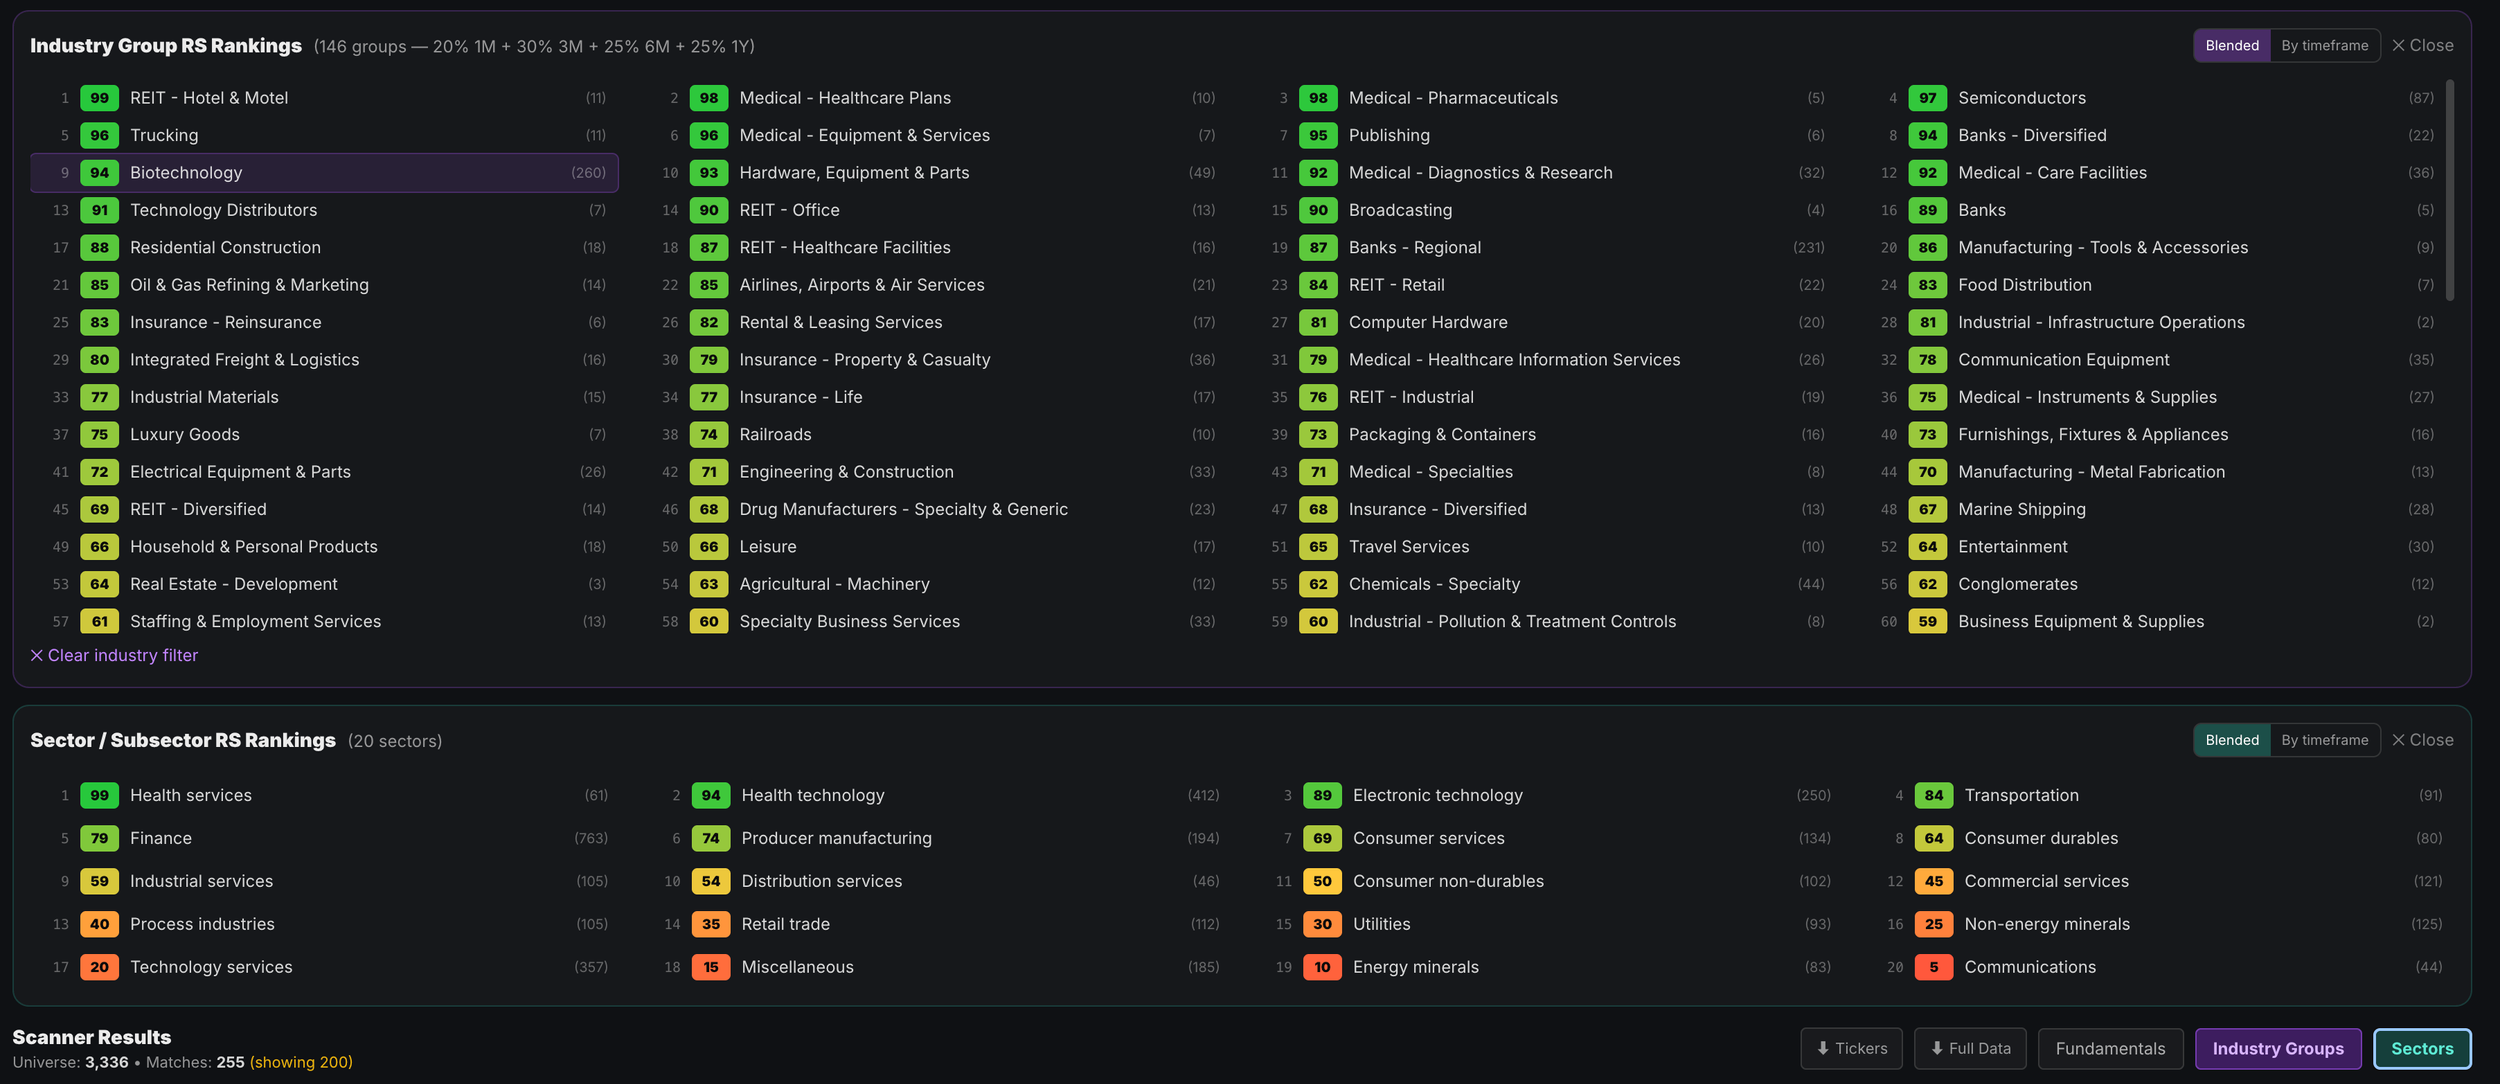
One of the best ways to slim down a relative strength list is to look at industry group strength. The strongest stocks usually do not move alone. They often move with other stocks in the same group.
That is not an accident. Institutions usually accumulate themes, not just isolated tickers. When semiconductors names are leading, you will often see several stocks in the group showing strong relative strength at the same time.
O’Neil paid close attention to industry group leadership, and IBD’s industry group ratings were designed to identify which groups were leading or lagging based on price performance.
This is why I do not just ask: Is this stock strong?
I also ask: Is the group strong? Are other names in the same theme confirming the move? Is this the true leader in the group?
That last question is important. A lot of traders buy the weaker stock in the group because it looks cheaper, but the market usually rewards the leader.
If one stock has the best earnings, best sales, best margins, best relative strength, and best chart, I would rather own that than the cheaper laggard trying to play catch-up.
Cheap is not a catalyst.
Leadership is.
How I Use Relative Strength in My Own ProcessOne of the best ways to slim down a relative strength list is to look at industry group strength. The strongest stocks usually do not move alone. They often move with other stocks in the same group.
That is not an accident. Institutions usually accumulate themes, not just isolated tickers. When semiconductors names are leading, you will often see several stocks in the group showing strong relative strength at the same time.
O’Neil paid close attention to industry group leadership, and IBD’s industry group ratings were designed to identify which groups were leading or lagging based on price performance.
This is why I do not just ask: Is this stock strong?
I also ask: Is the group strong? Are other names in the same theme confirming the move? Is this the true leader in the group?
That last question is important. A lot of traders buy the weaker stock in the group because it looks cheaper, but the market usually rewards the leader.
If one stock has the best earnings, best sales, best margins, best relative strength, and best chart, I would rather own that than the cheaper laggard trying to play catch-up.
Cheap is not a catalyst.
Leadership is.
How I Use Relative Strength in My Own Process
Before I even begin screening for high relative strength stocks, I want to make sure the market environment is healthy. I want growth stocks to be rewarded, leadership to be expanding, and the wind at my back. I am not trying to aggressively trade high RS names when the overall market is working against me, or when money is clearly rotating out of growth stocks and the leading industry groups.
This is why market direction matters so much. William O’Neil made the “M” in CAN SLIM stand for Market Direction because the action of the major indexes and individual leaders can determine whether you win big or lose.
If you are new to trading, I cover this in Modules 1 through 3 of the Momentum Trading Strategy Course, where I explain market environment, leadership, relative strength, and why trading with the wind at your back is so important.
When I am screening for growth stocks and momentum leaders, I usually start with relative strength. From there, I layer in additional filters depending on the market environment and how many names appear.
A simple process might start with stocks that have strong one-year RS. Then I look for stocks with strong short-term RS across the one-month, three-month, and six-month time frames. From there, I look for acceleration and remove stocks that are clearly decelerating or breaking down.
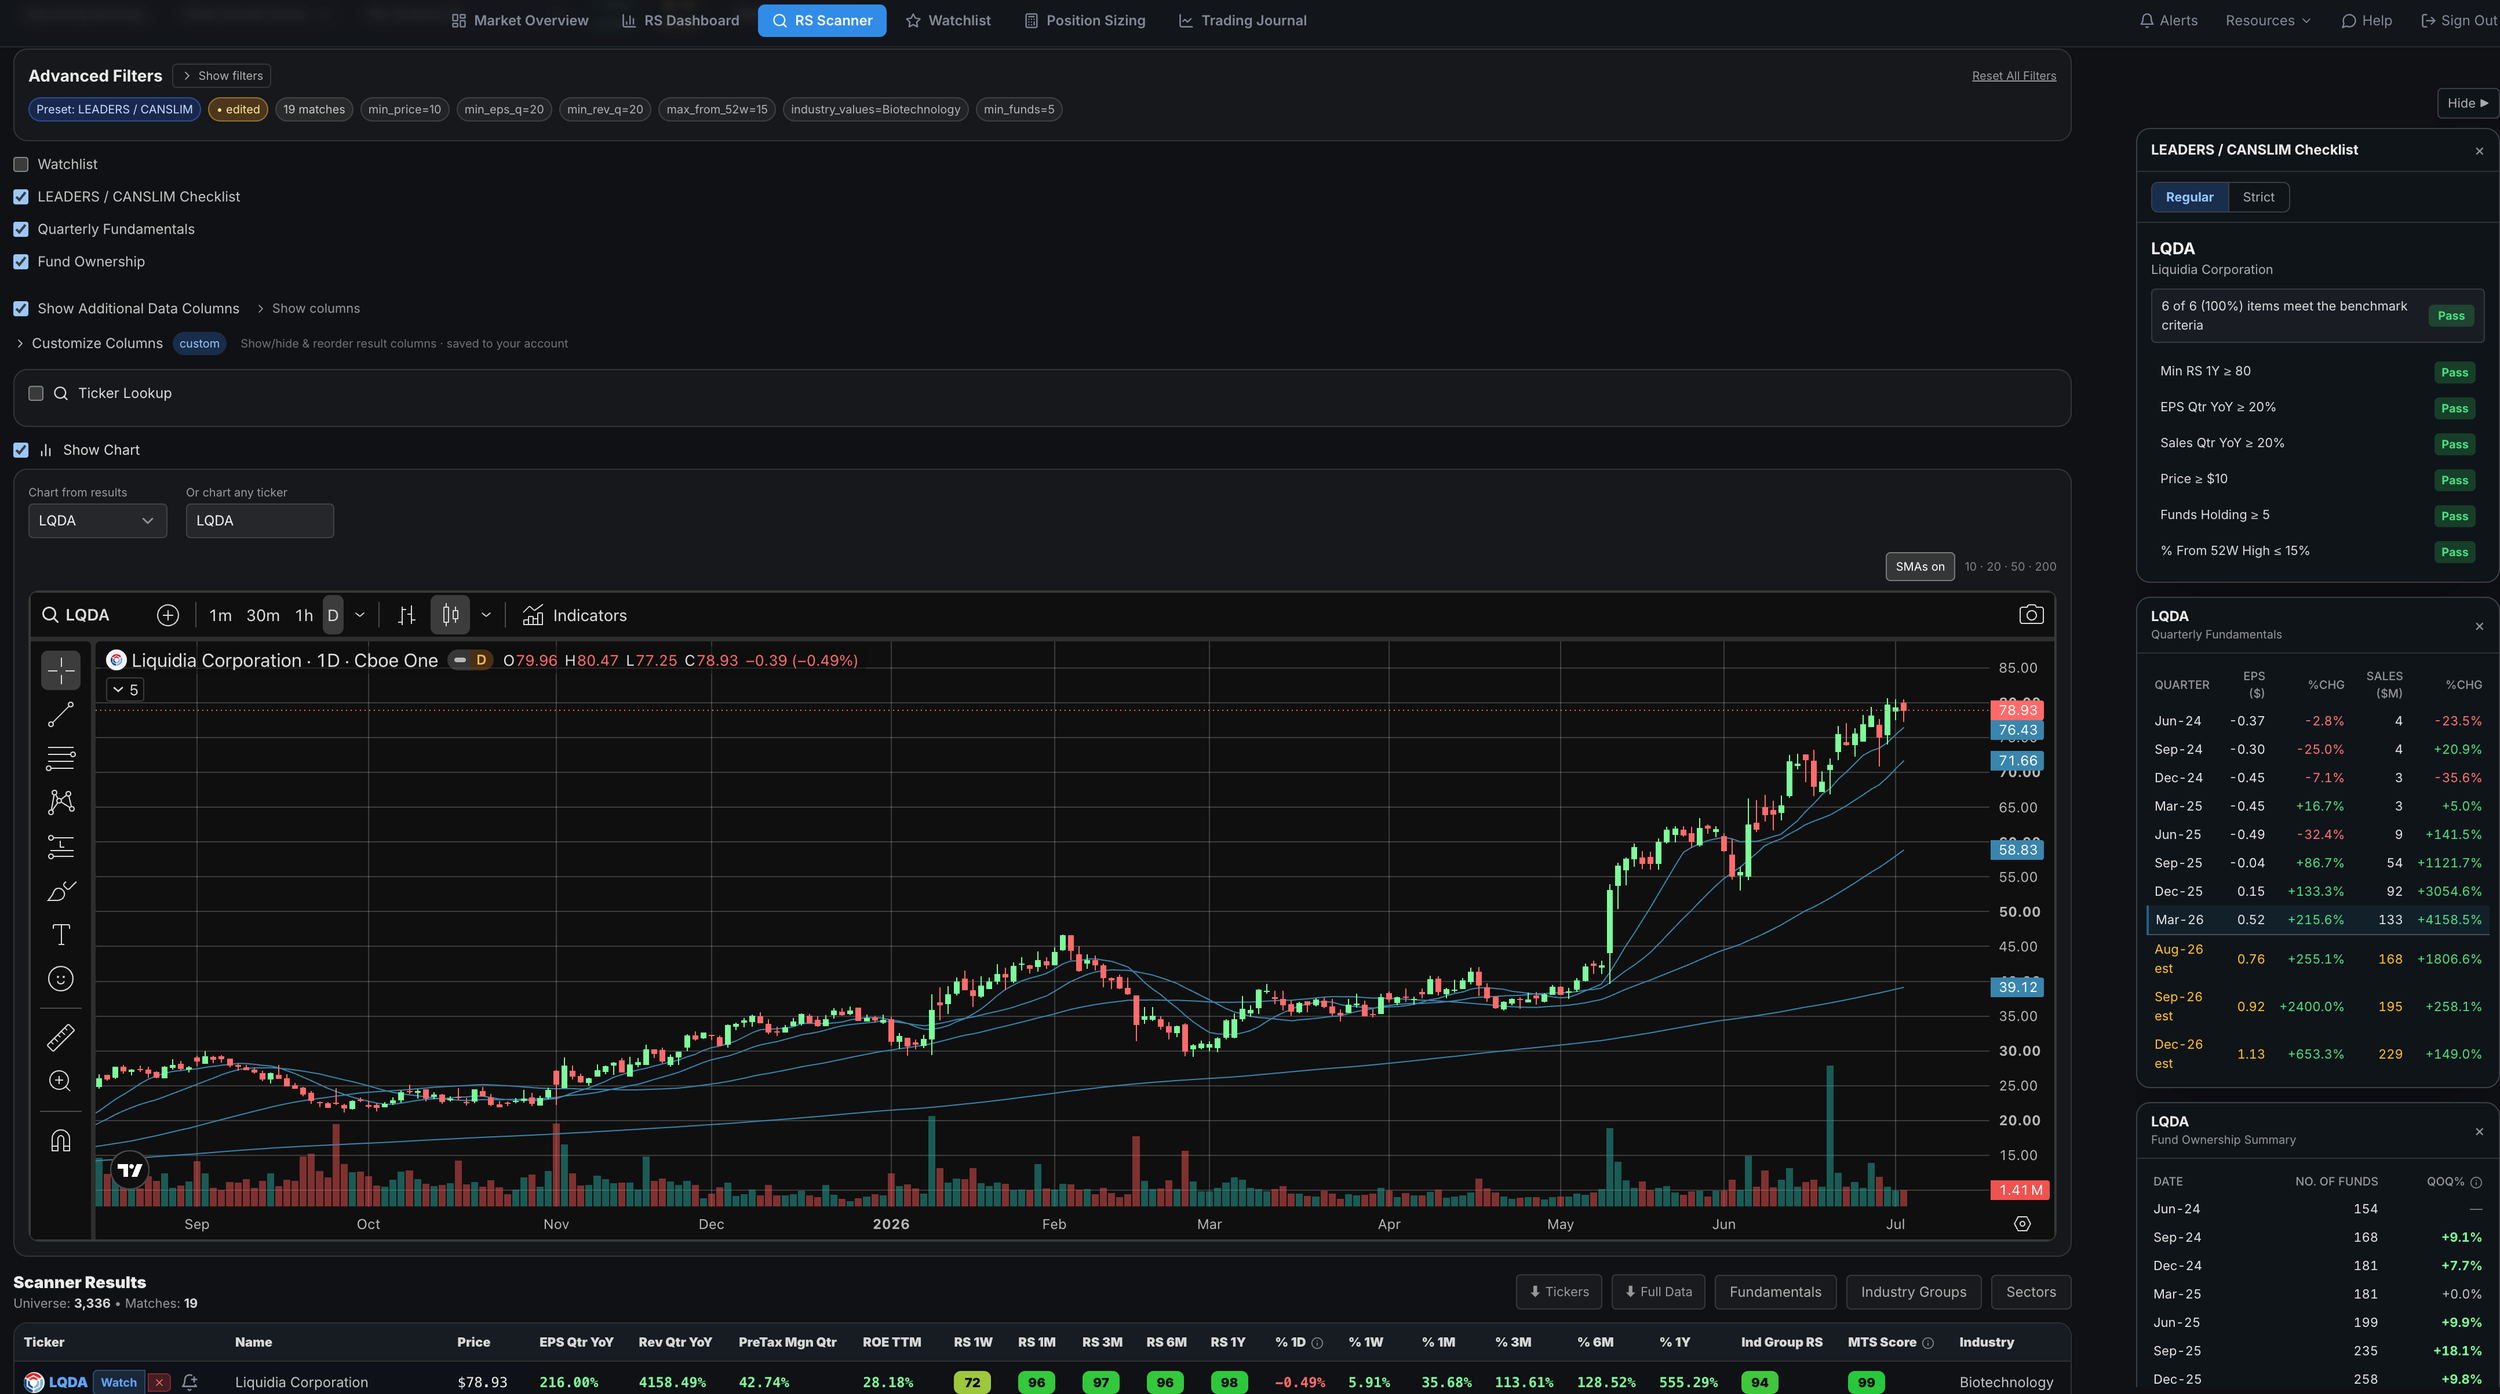
After that, I layer in earnings growth, sales growth, ROE, pre-tax margins, fund ownership, and industry group strength. Then I study the charts and wait for a setup where I can clearly define my risk.
If a stock is strong but not ready yet, I will add it to my watchlist under Watch. If it is getting closer to an actionable pivot point, I will move it to Near Pivot. This helps me keep track of strong names before they set up again, while putting more focus on the stocks that are getting closer to actionable buy areas.
That final step matters. A stock can have a 99 RS Rating and still be a bad trade if the entry is extended, the stop is too wide, or the risk and position size are too large.
Relative strength helps you find the merchandise.
Risk management keeps you alive.
The Biggest Mistake Traders Make With Relative Strength
The biggest mistake is thinking relative strength is a buy signal by itself. It is not. Relative strength is a filter.
It tells you where leadership is. It tells you where institutional demand may be. It tells you which stocks are outperforming. It tells you which names deserve your attention.
But it does not replace big picture market analysis, chart reading / price action, risk management, position sizing, stop losses, sell rules, or precision entries. The best traders use relative strength as part of a total process.
They find the leaders. They wait for proper setups. They define risk. They size correctly. They sell when the evidence changes. They avoid laggards. They do not fall in love with stories.
That is the game.
Why This Matters Right Now
Every market cycle produces a small group of true leaders. Most stocks will NOT be worth your time. Some will bounce. Some will look cheap. Some will have exciting stories. Some will get attention on social media. Some will fool traders into thinking they are early.
But the real leaders usually show up in the data. They show up in relative strength. They show up near new highs. They show up in strong industry groups. They show up with earnings and sales growth. They show up before most people believe the move is real.
That is why relative strength is not optional for my process. It is the foundation. If you are a growth stock or momentum trader and you are not using relative strength, you are making the job harder than it needs to be.
You are trying to find leaders without a leadership filter. You are trying to outperform while spending too much time on stocks that are already underperforming. You are trying to win a race by betting on the slowest horses.
There is a better way. Find the strongest stocks. Find the strongest groups. Find the names with real growth. Wait for proper setups. Manage risk like a professional. Let the market tell you where the leadership is.
That is what relative strength does, and that is why, if I could only use one stock screen for the rest of my life, it would be a relative strength stock screener.
Want to See the Leaders Before Everyone Else?
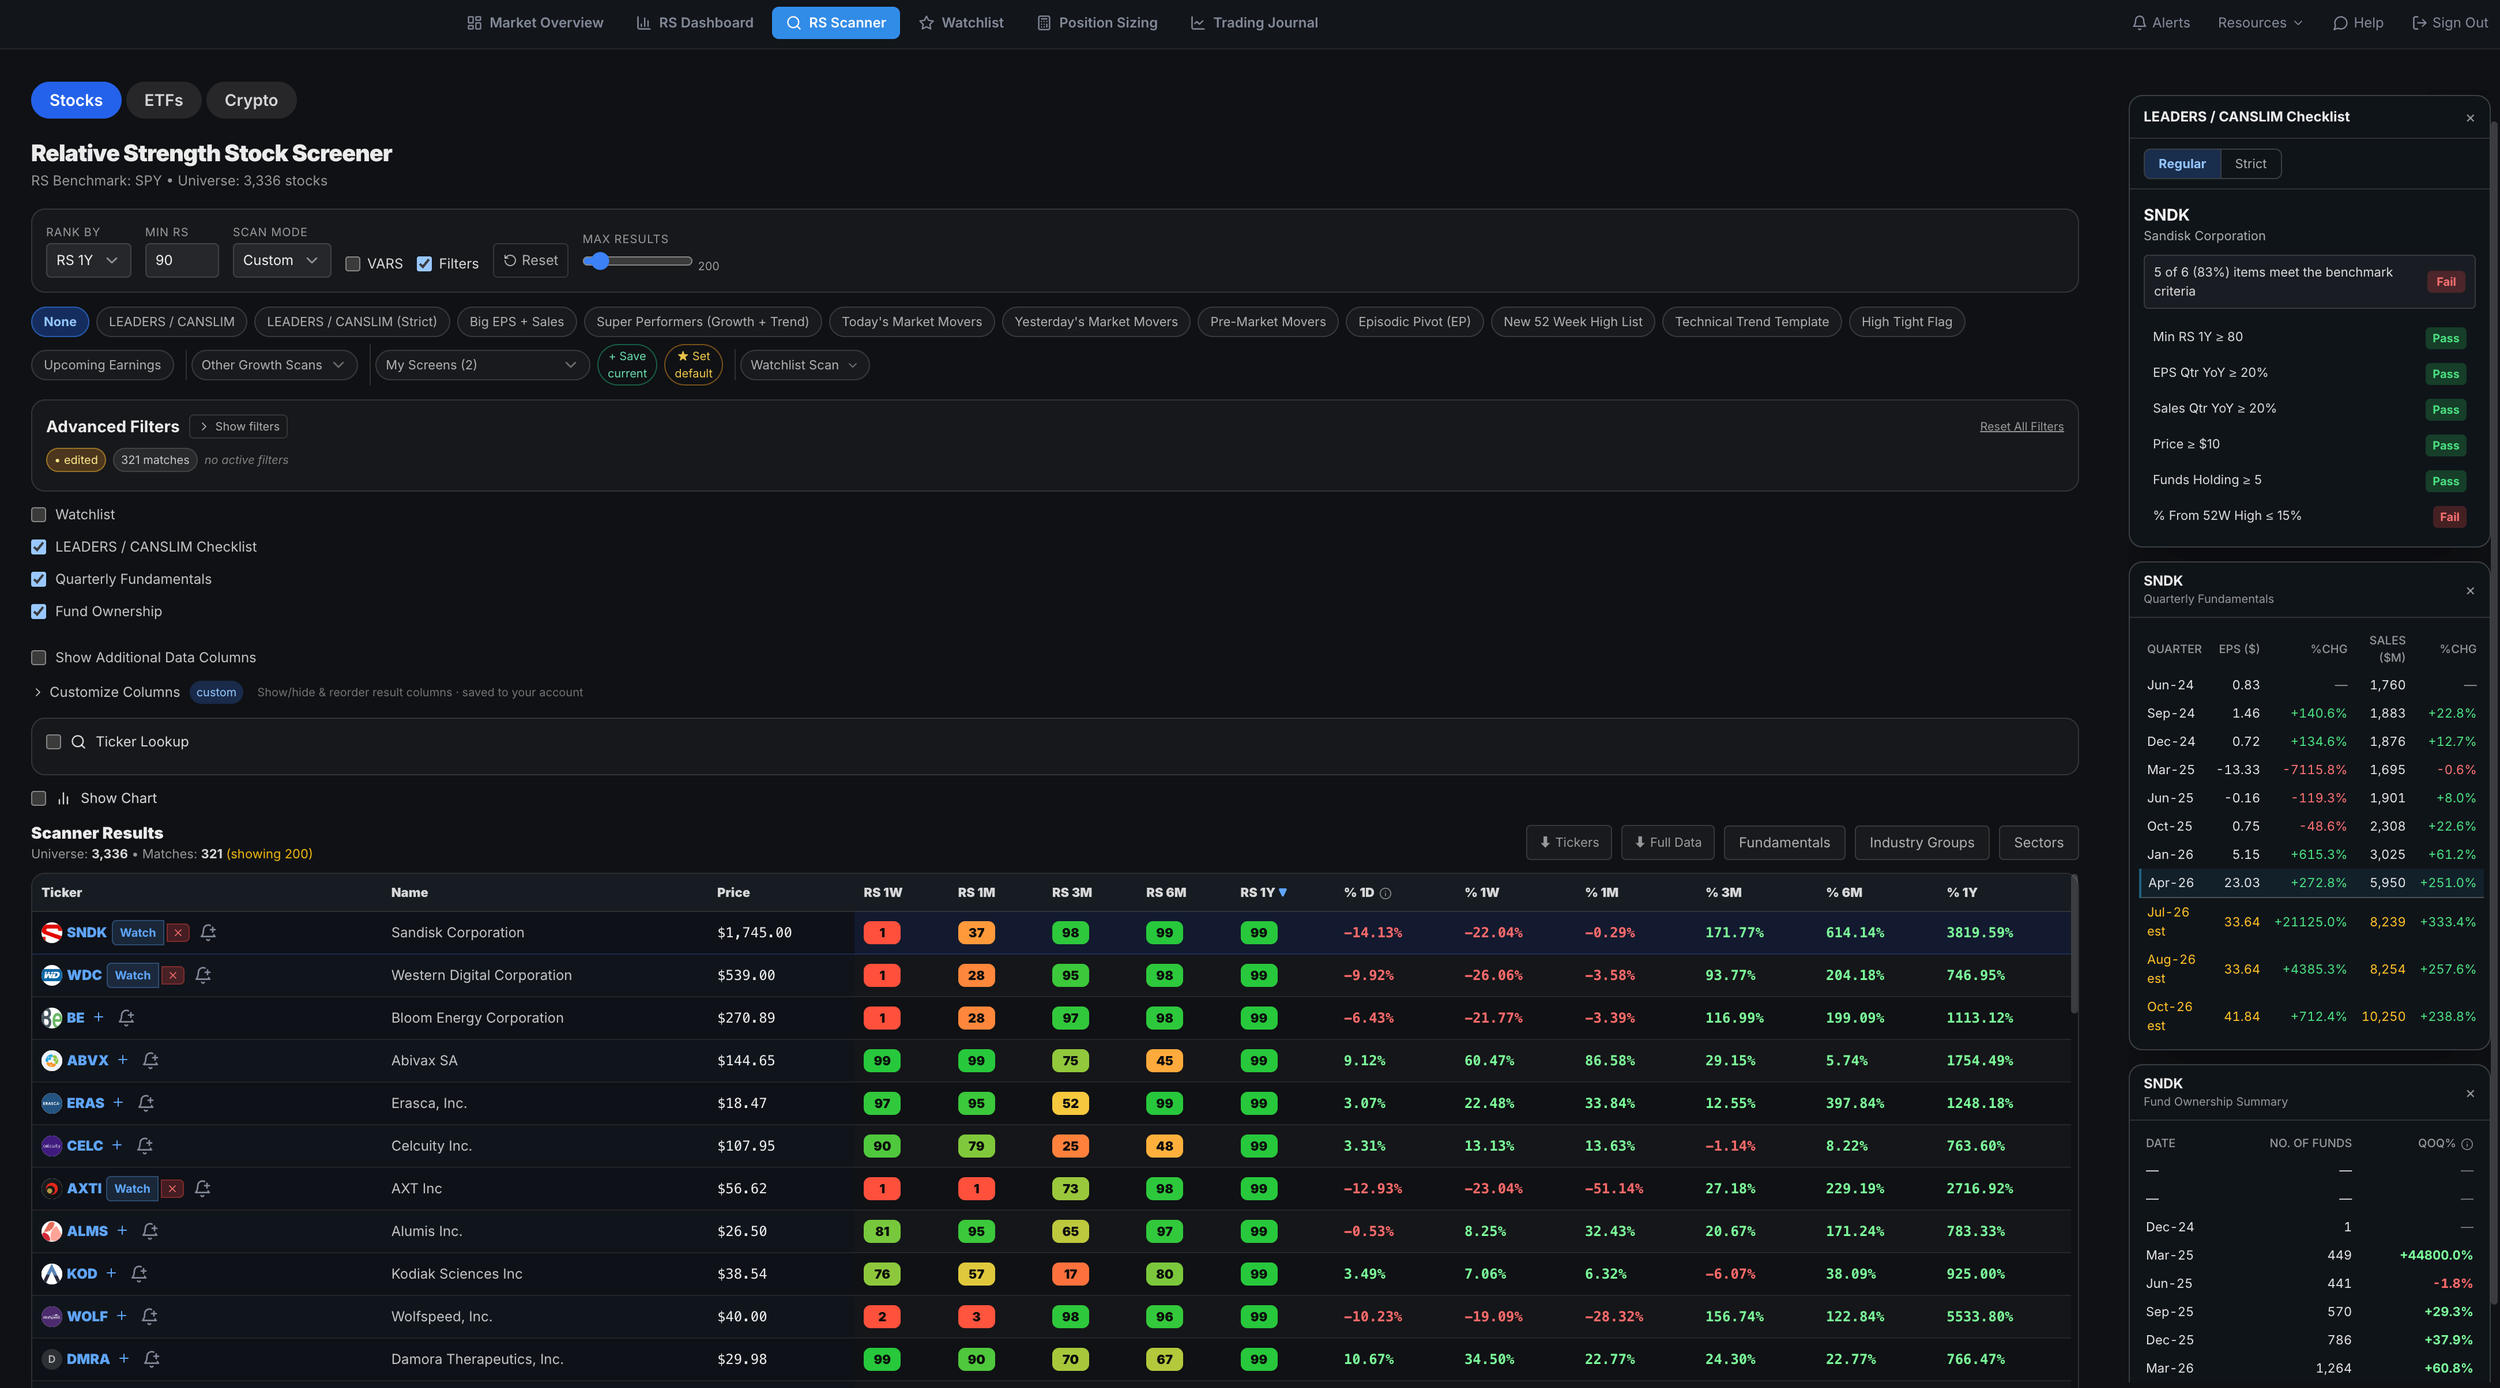
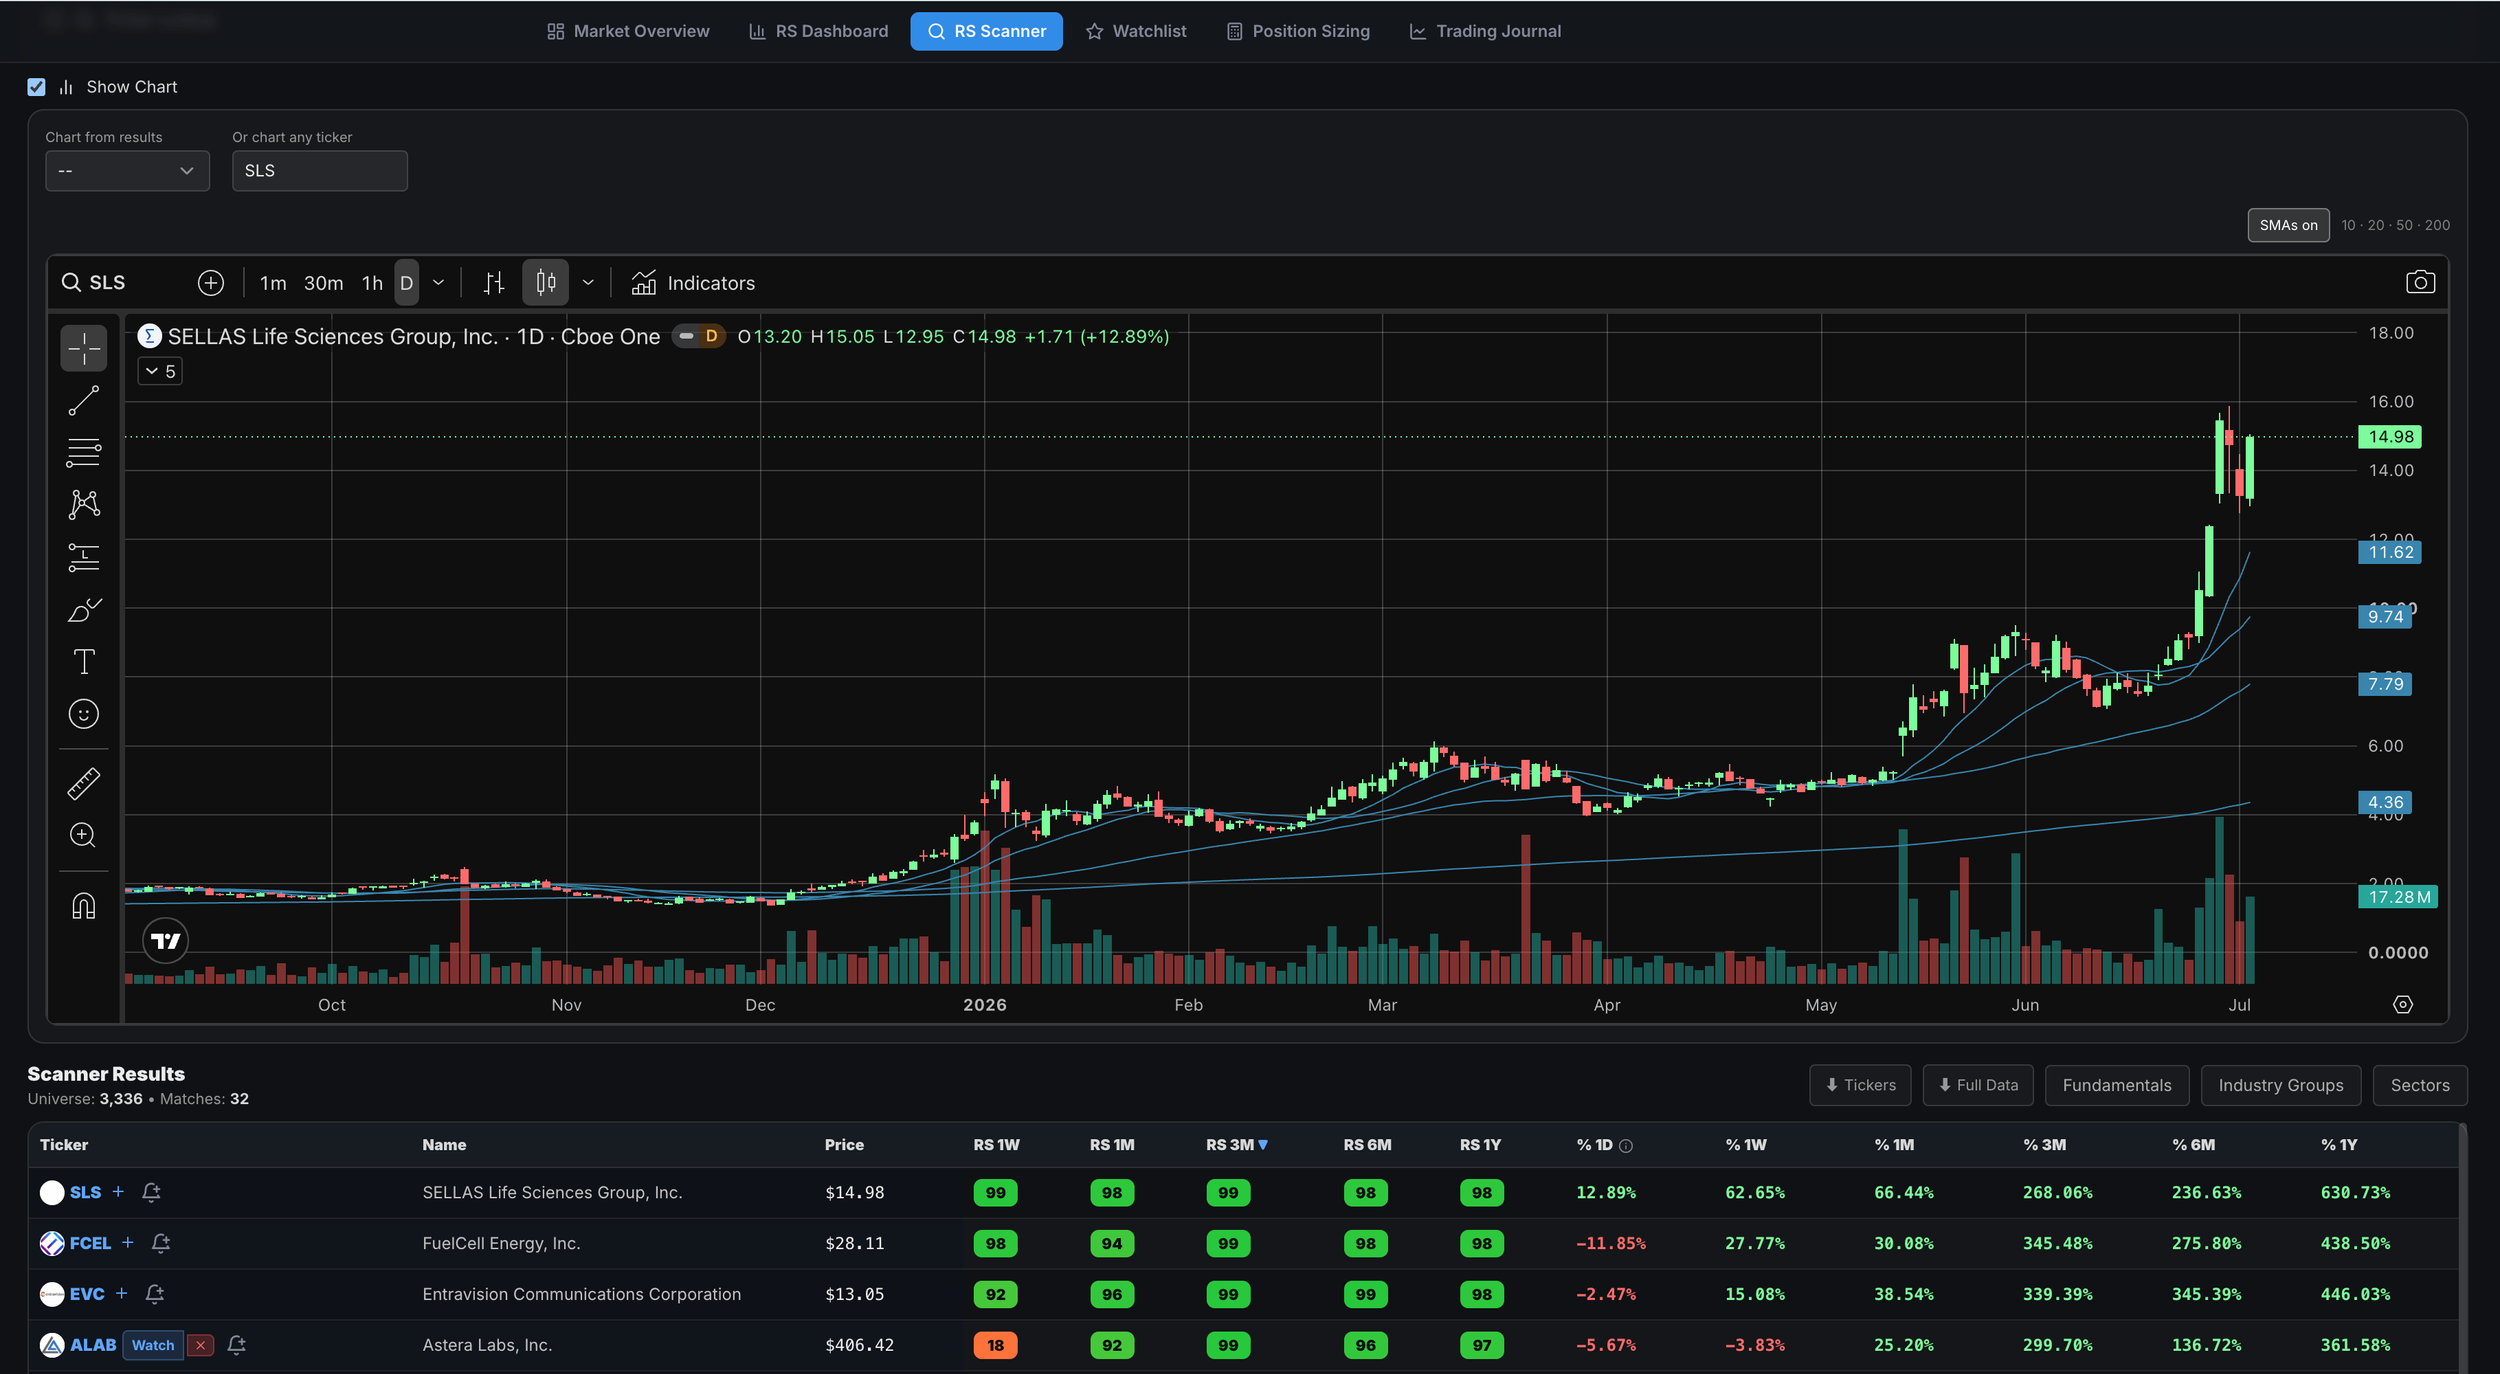
Inside the Momentum Trading Strategy Software, which all paid subscribers get access to, I built a Relative Strength Stock Screener around this exact process. It helps you screen for one-year relative strength, shorter-term relative strength, acceleration, deceleration, watchlist names, industry group RS, earnings, sales, fund ownership, and more.
The goal is simple: find the strongest stocks, avoid the laggards, build better watchlists, and trade with a repeatable process.
This screener was built from my own 20 years of trading experience, but more importantly, from the lessons handed down by many of the greatest traders and market operators in history. That includes Jesse Livermore, Bernard Baruch, Gerald Loeb, Nicolas Darvas, William O’Neil, David Ryan, Mark Minervini, Dan Zanger, Kristjan Kullamägi, many of the Market Wizards, and several U.S. Investing Champions.
If you are serious about growth stock investing and momentum trading, this is the type of tool that can help you stop guessing and start focusing on the names that actually deserve your attention.
Relative strength shows you where the leaders are.
Other Articles and Resources on Stock Screening
If you want to see how I actually scan for big winners, these next breakdowns go deeper into the full process. I show how I use relative strength inside a broader stock screening framework to find potential market leaders before they become obvious to the crowd.
Start here:
How I Find the Biggest Winning Stocks
Want to Go Deeper?
All-Access includes the Momentum Trading Strategy Course, MTS Velocity software, and the Big Picture Market Pulse newsletter.
