
Most Traders Get Position Sizing Wrong
How to align technical stops, position sizing, and portfolio exposure into a complete risk management framework
You’ve probably spent countless hours learning setups.
You probably already know where you would buy.
You probably already know where you would get out if you were wrong.
But here’s the uncomfortable question most traders never ask:
Once you know those two numbers… do you actually know how big the trade should be?
Most traders think they do.
They pick a percentage they want to risk.
They estimate the shares.
They click buy.
And yet something still feels slightly off.
That subtle tension isn’t random.
It’s your brain recognizing a mismatch between what you think your risk is and what it actually is.
The Kovner Doctrine
Bruce Kovner once said:
“Whenever I enter a position, I have a predetermined stop. That is the only way I can sleep. I know where I’m getting out before I get in. The position size on a trade is determined by the stop, and the stop is determined on a technical basis.”
That’s the sequence.
The market defines invalidation.
The stop sits beyond a real technical barrier.
Position size adjusts to that stop.
Portfolio allocation controls concentration.
Most traders invert that.
They choose size first.
Then force the stop to fit.
That’s sizing backwards.
Example 1: ORB Setup
In our previous post, we broke down Kullamägi’s Opening Range Breakout (ORB) tactic.
In an ORB:
The opening range defines structure.
The breakout defines momentum.
The low of the range defines invalidation.
If price breaks out and then fails back through the opening range low, the thesis is wrong.
The stop is structural.
Not emotional.
Not arbitrary.
That satisfies Kovner’s rule.
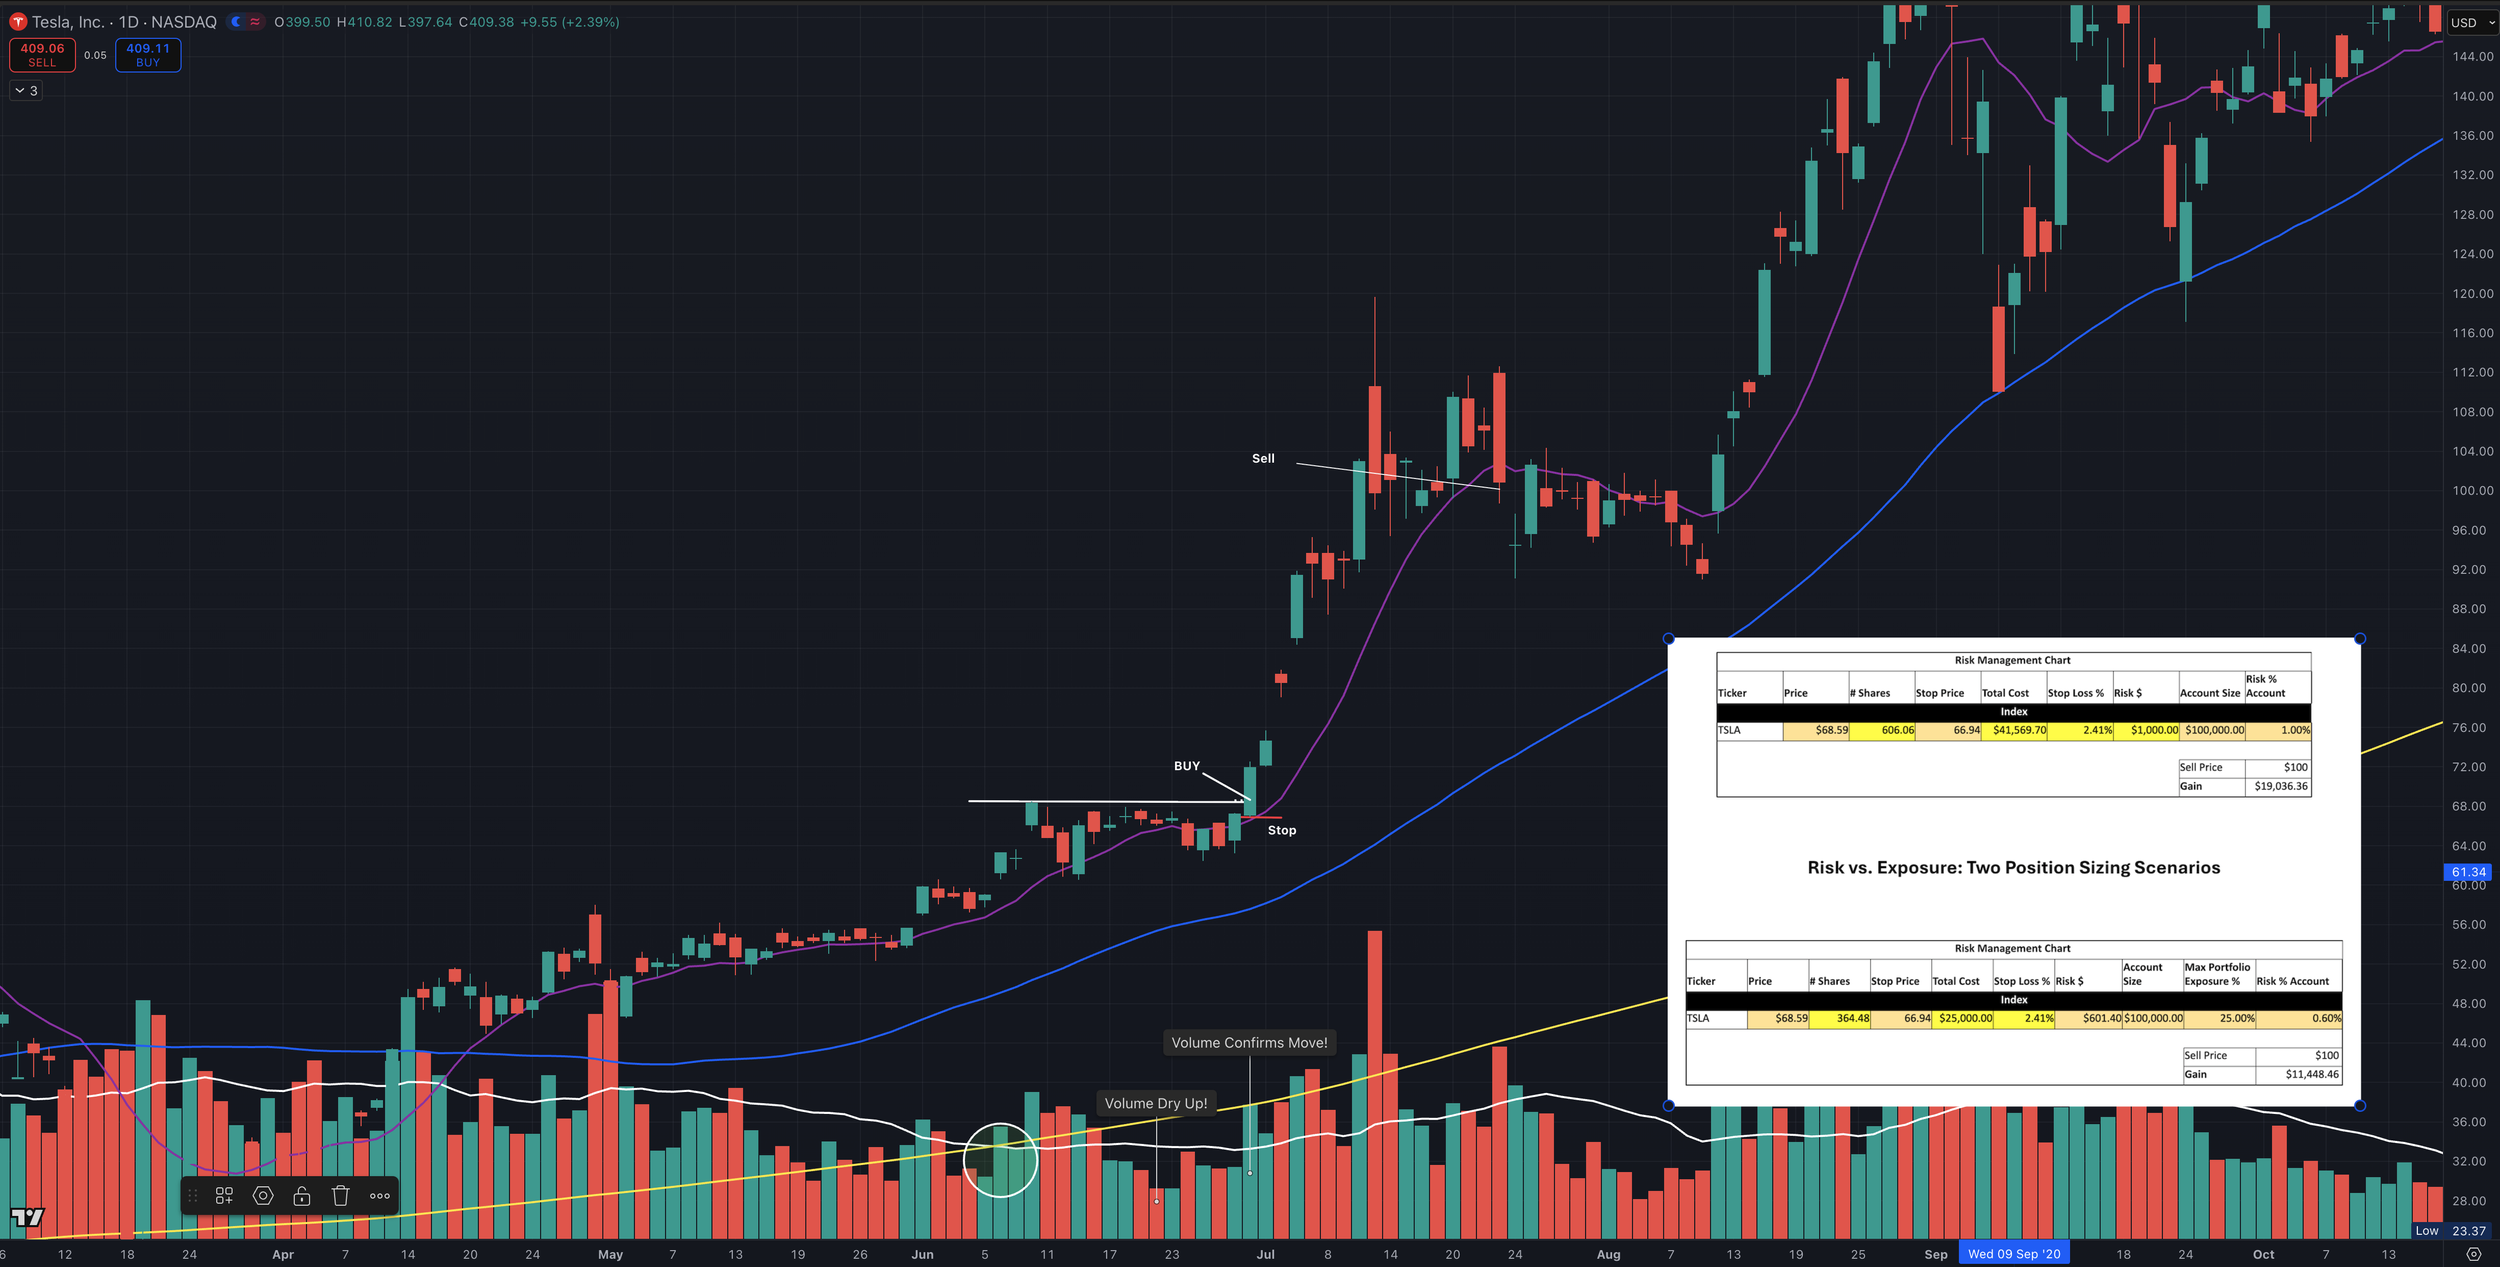
(ORB chart with entry, stop, and risk vs exposure tables overlay)
ORB Math Walkthrough
Entry: $68.59
Stop: $66.94
Stop distance: $1.65
Stop loss %: 2.41%
Account: $100,000
Risk per trade: 1% ($1,000)
Position size:
$1,000 ÷ $1.65 ≈ 606 shares
Capital committed:
606 × $68.59 ≈ $41,569
Under pure risk-based sizing:
Risk = $1,000 (1%)
Exposure = ~41% of account
This is the key distinction:
You are risking 1%.
But you are exposing 41% of your capital.
That’s not inherently wrong. But in professional portfolio management, allocating more than 25–30% of capital to a single name is considered concentrated risk.
Adding Exposure Constraint
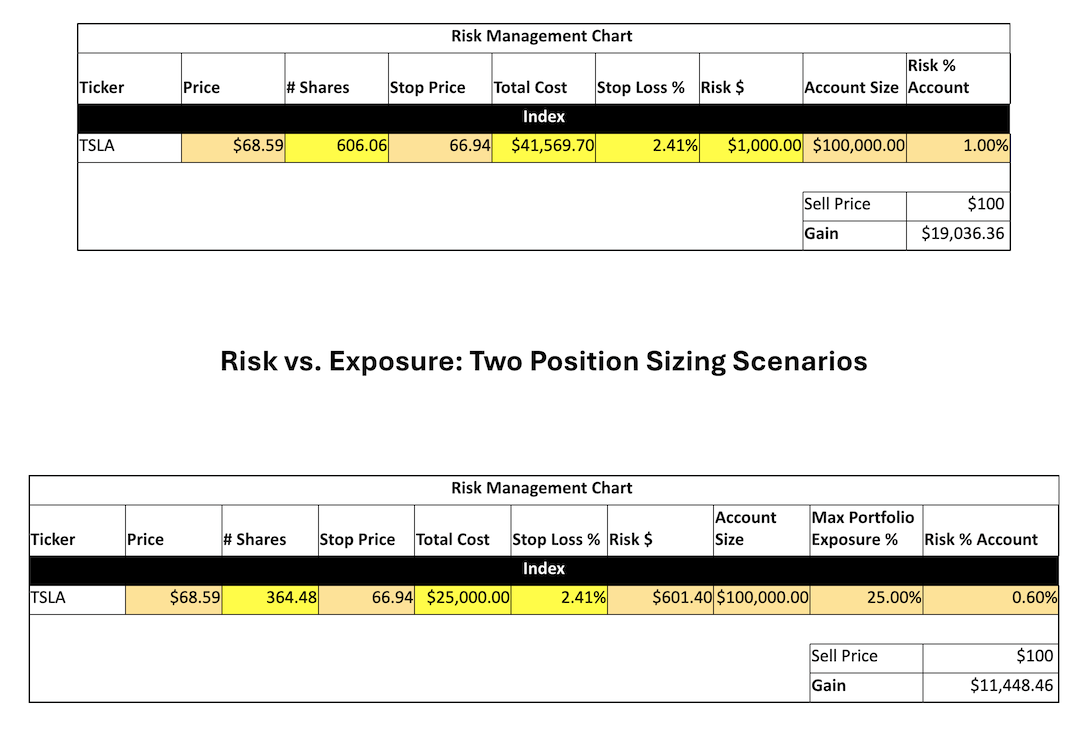
Now apply a 25% max exposure cap.
Position size becomes:
364 shares
Capital committed ≈ $25,000
Actual risk:
364 × $1.65 ≈ $601
Risk % ≈ 0.60%
Same entry.
Same stop.
Same setup.
But exposure becomes the tighter constraint.
Risk compresses automatically.
That’s portfolio discipline.
Example 2: Flat Base Breakout
Now let’s look at a structurally different setup.
Instead of an ORB with a tight stop, this example uses a flat base breakout with a wider structural stop.
Stop: $62.42
Entry: $68.59
Stop distance: $6.17
Stop loss % ≈ 9.00%
Now the technical structure demands a wider stop.
You don’t shrink the stop to make sizing easier.
You adjust the size.
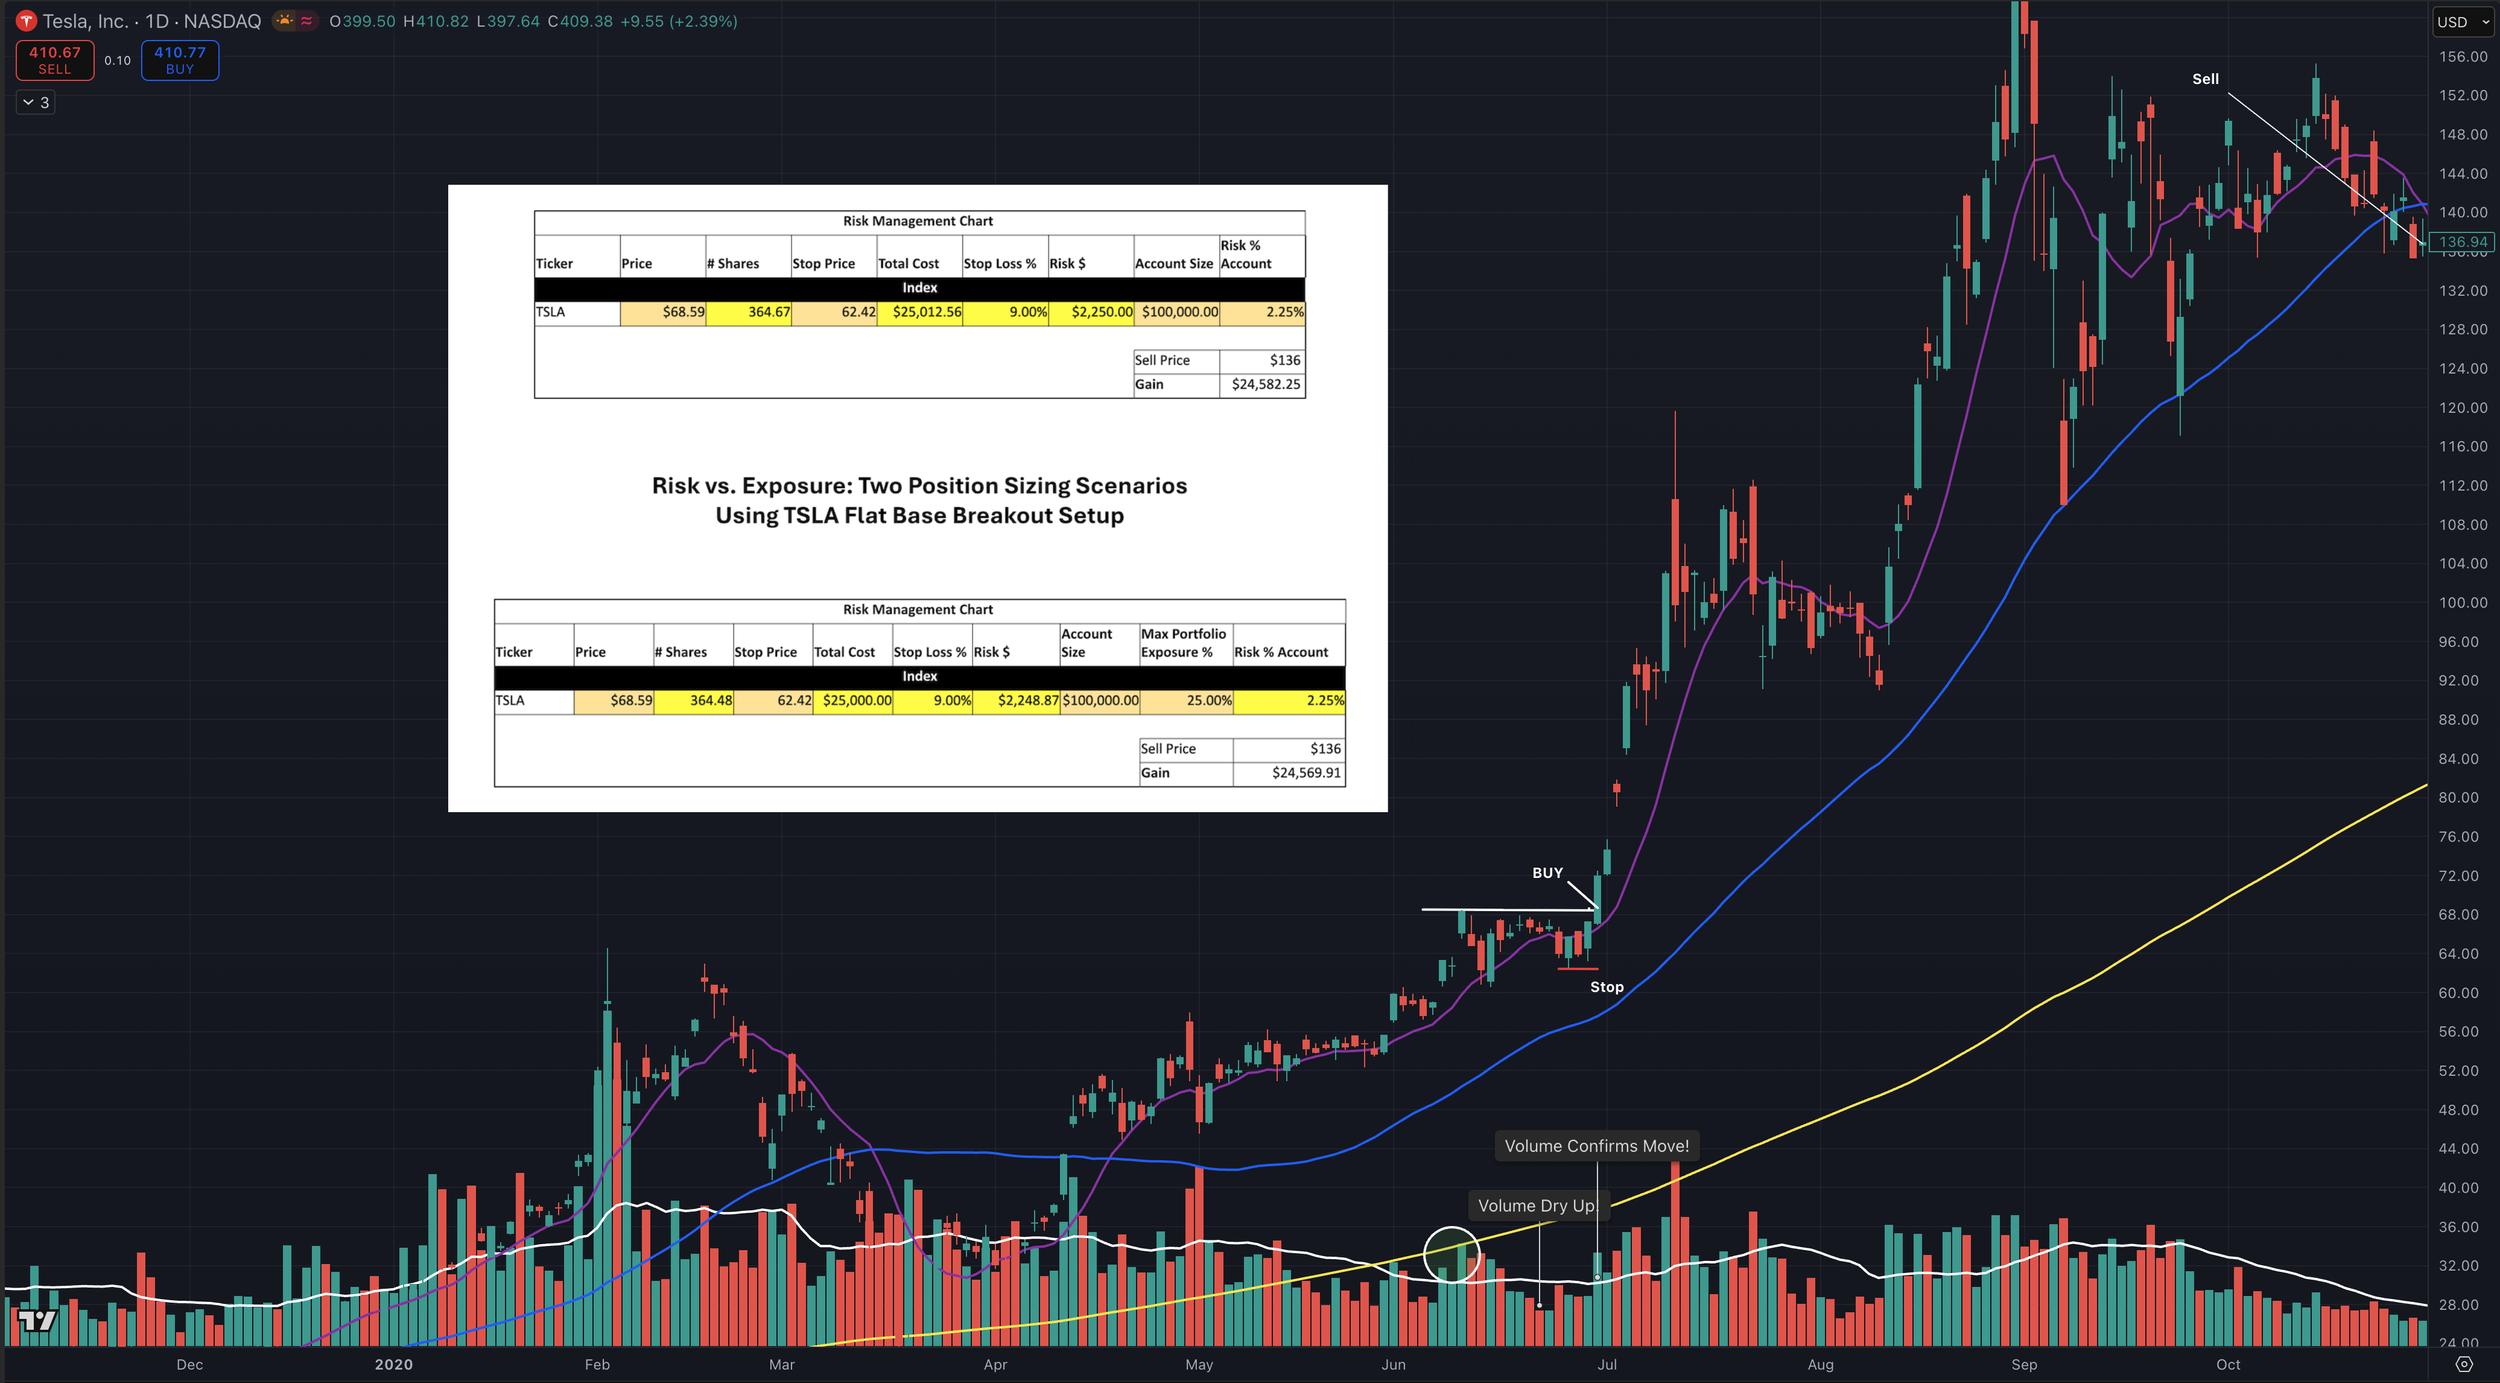
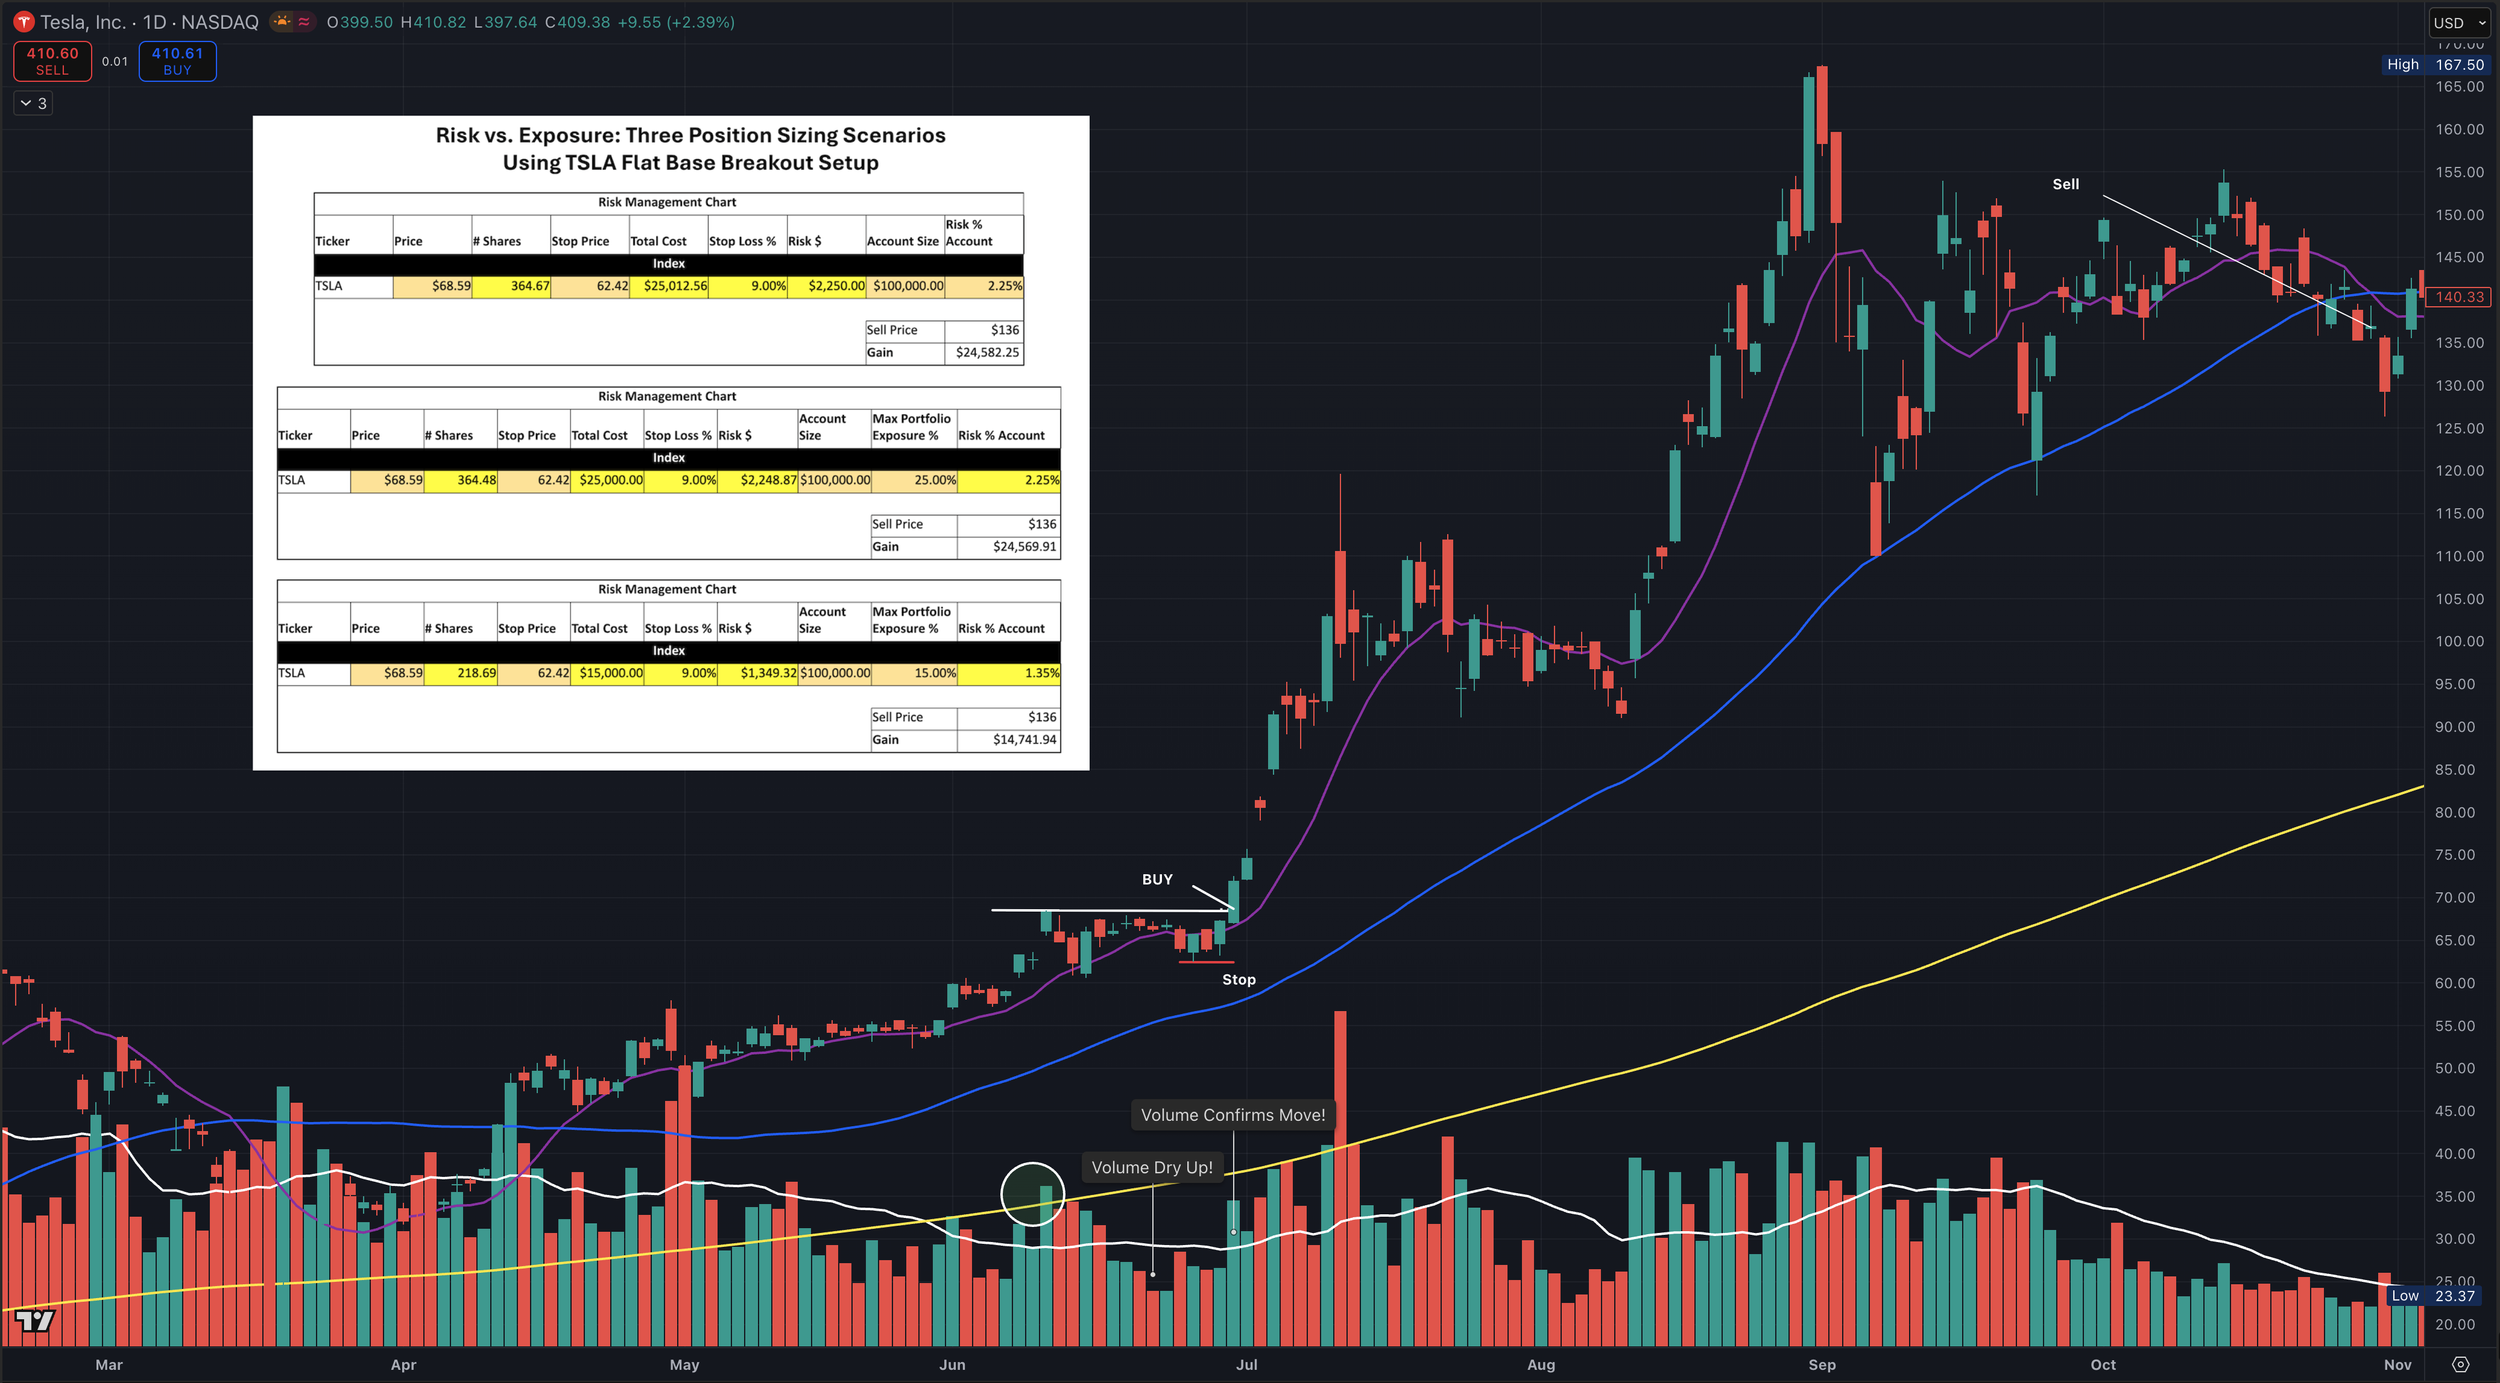
(Flat Base breakout chart with risk vs exposure tables)
Math Walkthrough
Exposure cap: $25,000
Shares ≈ 364
Risk:
364 × $6.17 ≈ $2,248
Risk % ≈ 2.25%
Notice the difference:
In the ORB example:
Tight stop
Larger share size possible
Exposure becomes constraint
In the Flat Base example:
Wider stop
Risk increases
Exposure and risk interact differently
Same price.
Different structure.
Different stop.
Different sizing outcome.
The chart dictates the stop.
The stop dictates the size.
The portfolio dictates the exposure ceiling.
Stop Quality Matters
Kovner warned about placing stops inside a range.
In the ORB example, placing the stop inside the opening range would:
Increase share size
Increase exposure
Increase noise stop-outs
In the Flat Base example, placing the stop too tight would:
Ignore structural support
Create false precision
Distort risk calculations
Technical stop placement quality directly impacts position sizing dynamics.
Regime Awareness
Stop placement does not exist in isolation.
It exists inside a market environment.
Dr. Van Tharp describes six primary market types:
Bull quiet
Bull volatile
Sideways quiet
Sideways volatile
Bear quiet
Bear volatile
Each regime changes how structure behaves.
In a Bull Quiet regime:
Breakouts hold.
Higher lows are respected.
Stops can often sit just below the prior higher low.
In a Bull Volatile regime:
Ranges expand.
Intraday swings widen.
Stops need more room beneath structural pivots.
In a Sideways Volatile regime:
Breakouts fail frequently.
Higher lows are often wicked through.
Stops placed too tightly inside recent structure get taken out.
This directly affects position sizing.
When volatility expands:
Structure widens.
Stop distance increases.
Risk per share increases.
Position size must contract.
When volatility compresses:
Structure tightens.
Stop distance decreases.
Risk per share decreases.
Position size can expand within exposure limits.
If you ignore regime, you distort sizing.
You may think you are using a technical stop.
But if that stop sits inside unstable structure during a volatile regime, it is not structural. It is vulnerable.
Regime determines volatility.
Volatility determines structure.
Structure determines stop distance.
Stop distance determines capital allocation.
This is why position size is never chosen first.
It is revealed by the environment the chart is operating in.
Correlation Risk
Even with a 25% exposure cap, concentration can still build quietly.
If you hold four breakout trades in the same sector, driven by the same factor, during the same volatility regime, you do not have four independent positions.
You have thematic stacking.
For example:
Four momentum tech breakouts
Same volatility expansion
Same liquidity conditions
Same market driver
If the theme unwinds, they unwind together.
Now your portfolio is not 4 × 1% risk.
It is correlated risk.
Professional adjustment rule:
When positions share the same factor profile, reduce per-position exposure or risk by 30 to 50 percent.
This prevents synchronized drawdowns and protects portfolio heat from accelerating unexpectedly.
Portfolio construction is not just about position size.
It is about independence of outcomes.
The Risk Stack
Every position flows through the same hierarchy.
Regime shapes volatility.
Volatility shapes structure.
Structure defines the stop.
The stop defines risk per share.
Risk per share defines position size.
Portfolio rules define capital allocation.
If any layer changes, size changes.
Not the stop.
Not the structure.
The size.
Position size is not chosen.
It is revealed.
Want to Go Deeper?
All-Access includes the Momentum Trading Strategy Course, MTS Velocity software, and the Big Picture Market Pulse newsletter.
