
How the Market Warns You Before the Crash (and When It’s Safe to Get Back In)
“The market always gives you clues. You just have to be willing to listen.” — Stan Weinstein
Most investors think market crashes come out of nowhere. In reality, the market always gives warning signs before major tops, and clear confirmation when a new bull market begins. If you learn to read market structure, you’ll see the same patterns repeat decade after decade.
In this post, I’ll walk you through how to spot those transitions using principles from Stan Weinstein, William J. O’Neil, and Brian Shannon, and how to use them to protect capital and profit from trend alignment.
Market Structure 101
Every major cycle follows the same blueprint:
Uptrends: Higher highs and higher lows
Downtrends: Lower highs and lower lows
When that structure shifts, it signals a change in character: a transition between bull and bear markets.
Combine this with two critical elements:
The 200-day simple moving average (SMA)
Volume confirmation
…and you have a complete framework for understanding where you are in the market cycle.
The 2000 Market Top – The Dot-Com Warning

In early 2000, the Nasdaq printed a massive reversal candle on heavy volume: the first warning shot of distribution.
Then came a lower high and a close below the 200-day SMA. Once that happened, the character of the market changed from accumulation to distribution.
Even if you didn’t catch the exact top, the lower low and persistent selling volume gave multiple chances to step aside before the crash deepened.
💡 Lesson: Respect structure and moving averages; they tell you when the tide has turned.
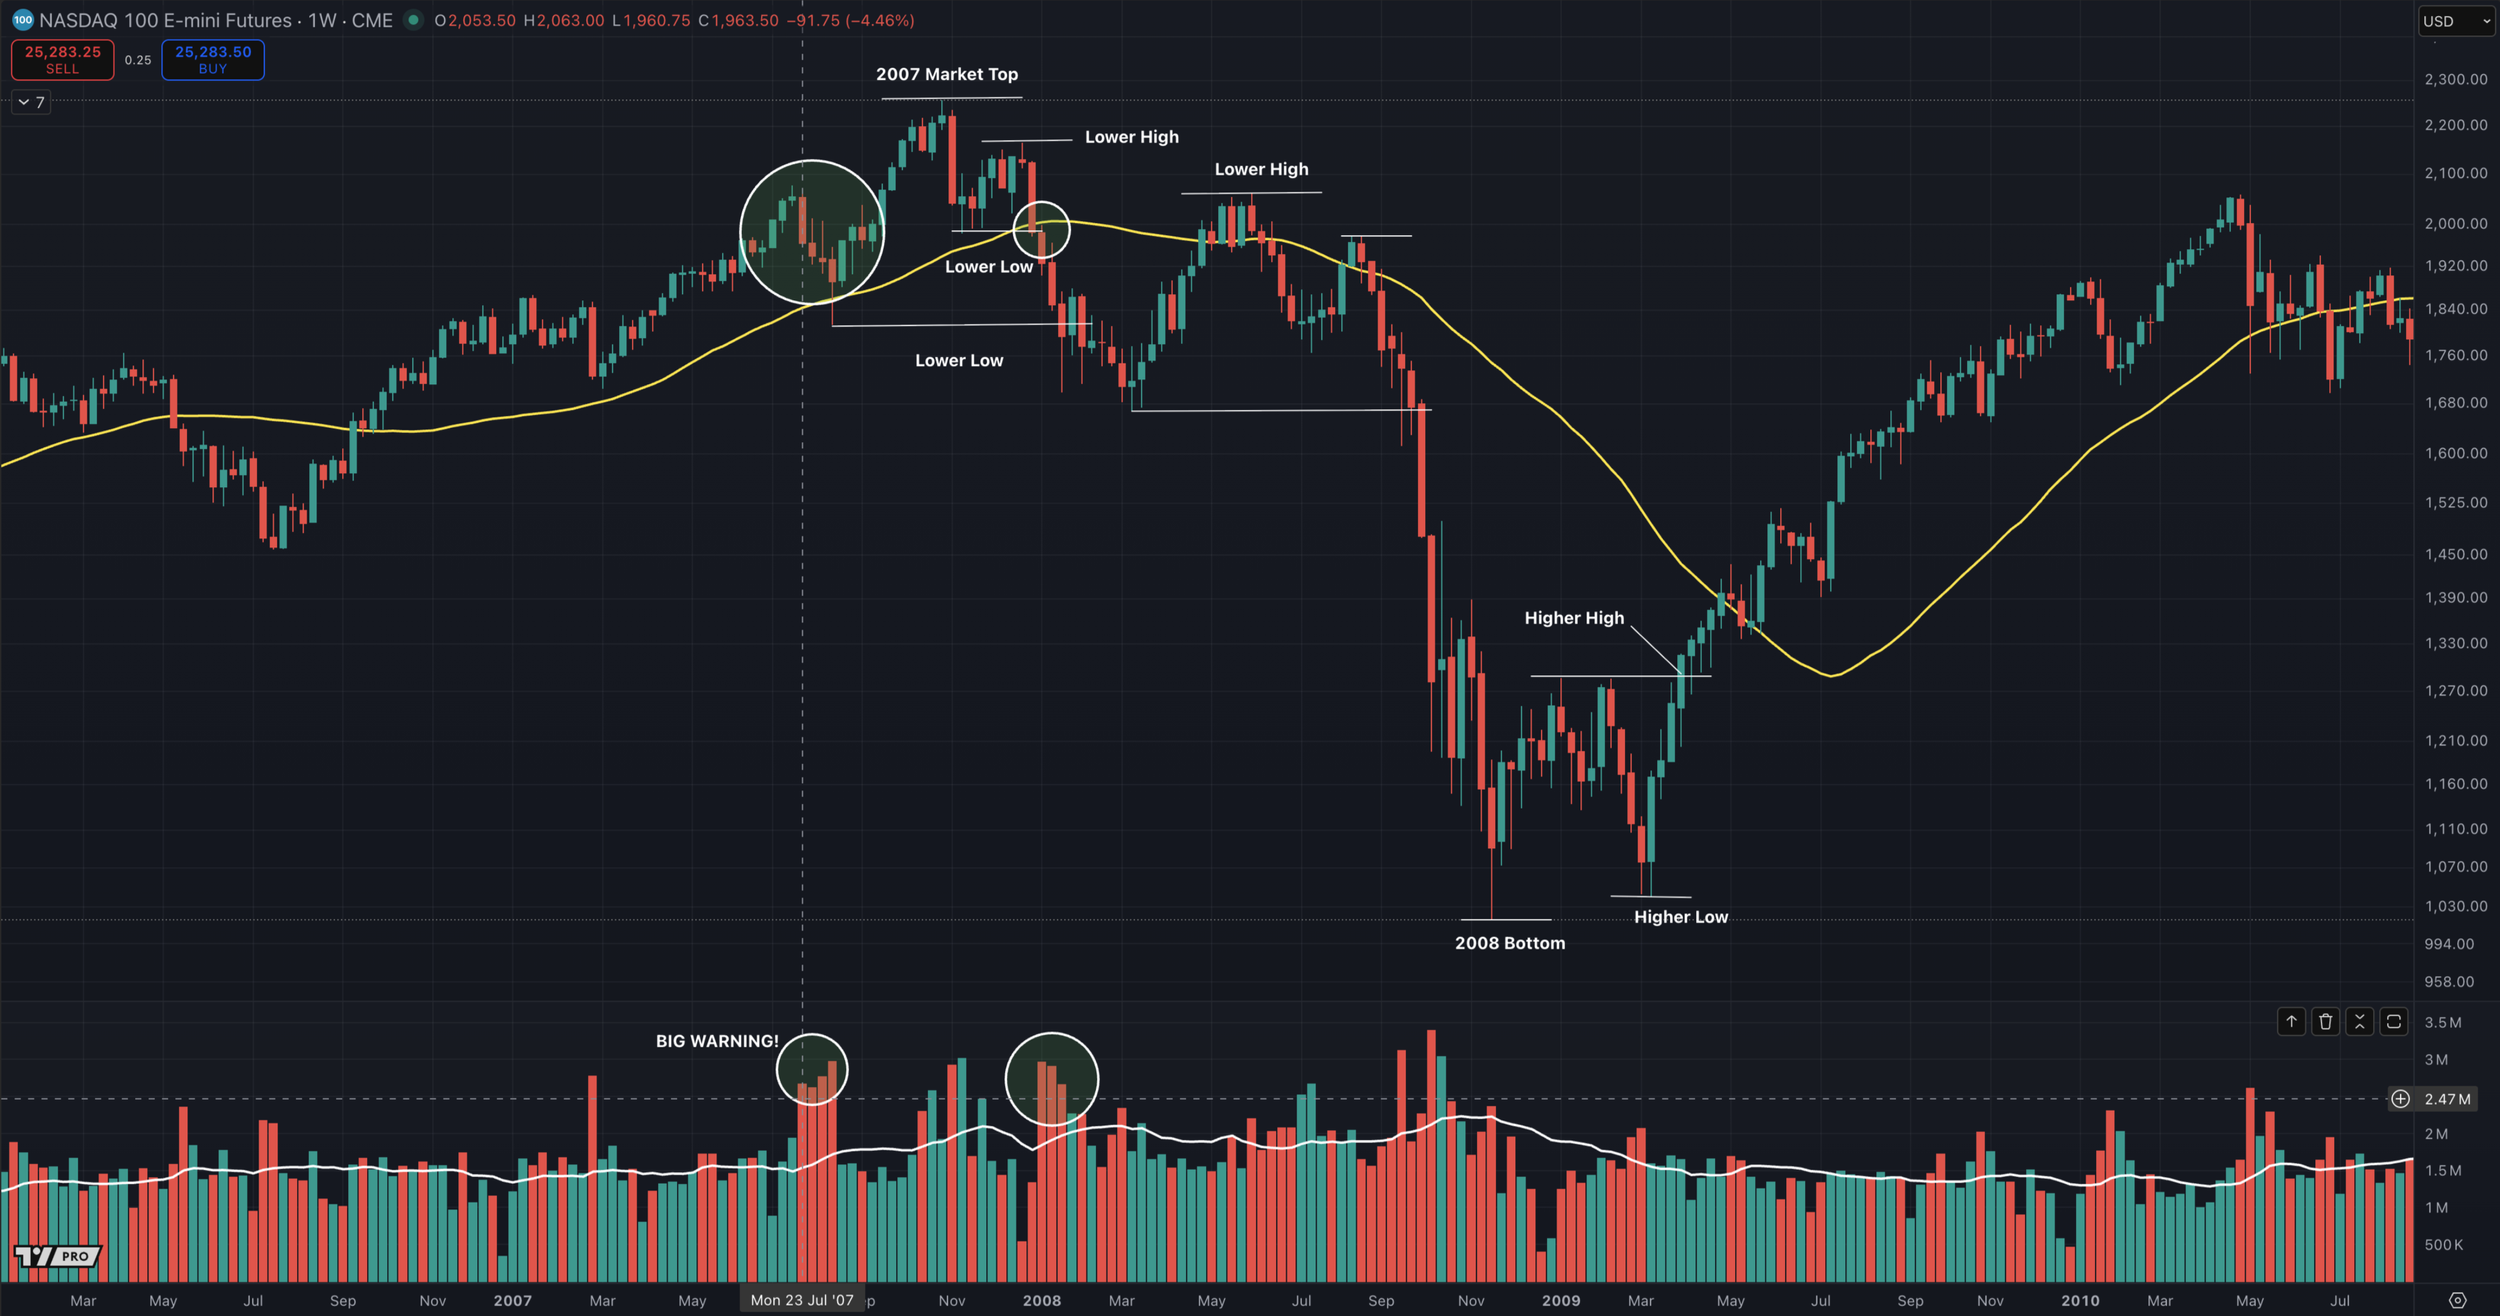
The 2007 Market Top – Déjà Vu

Fast forward seven years. The same setup appeared: a series of lower highs, a break below the 200 SMA, and massive weekly selling volume.
From there, the 2008 bear market unfolded. When the higher low and higher high finally appeared in early 2009, the structure flipped, signaling a new bull market.
Two simple observations, lower highs at the top, higher highs at the bottom, could have saved years of drawdowns.
The 2022 Bear Market – Same Script
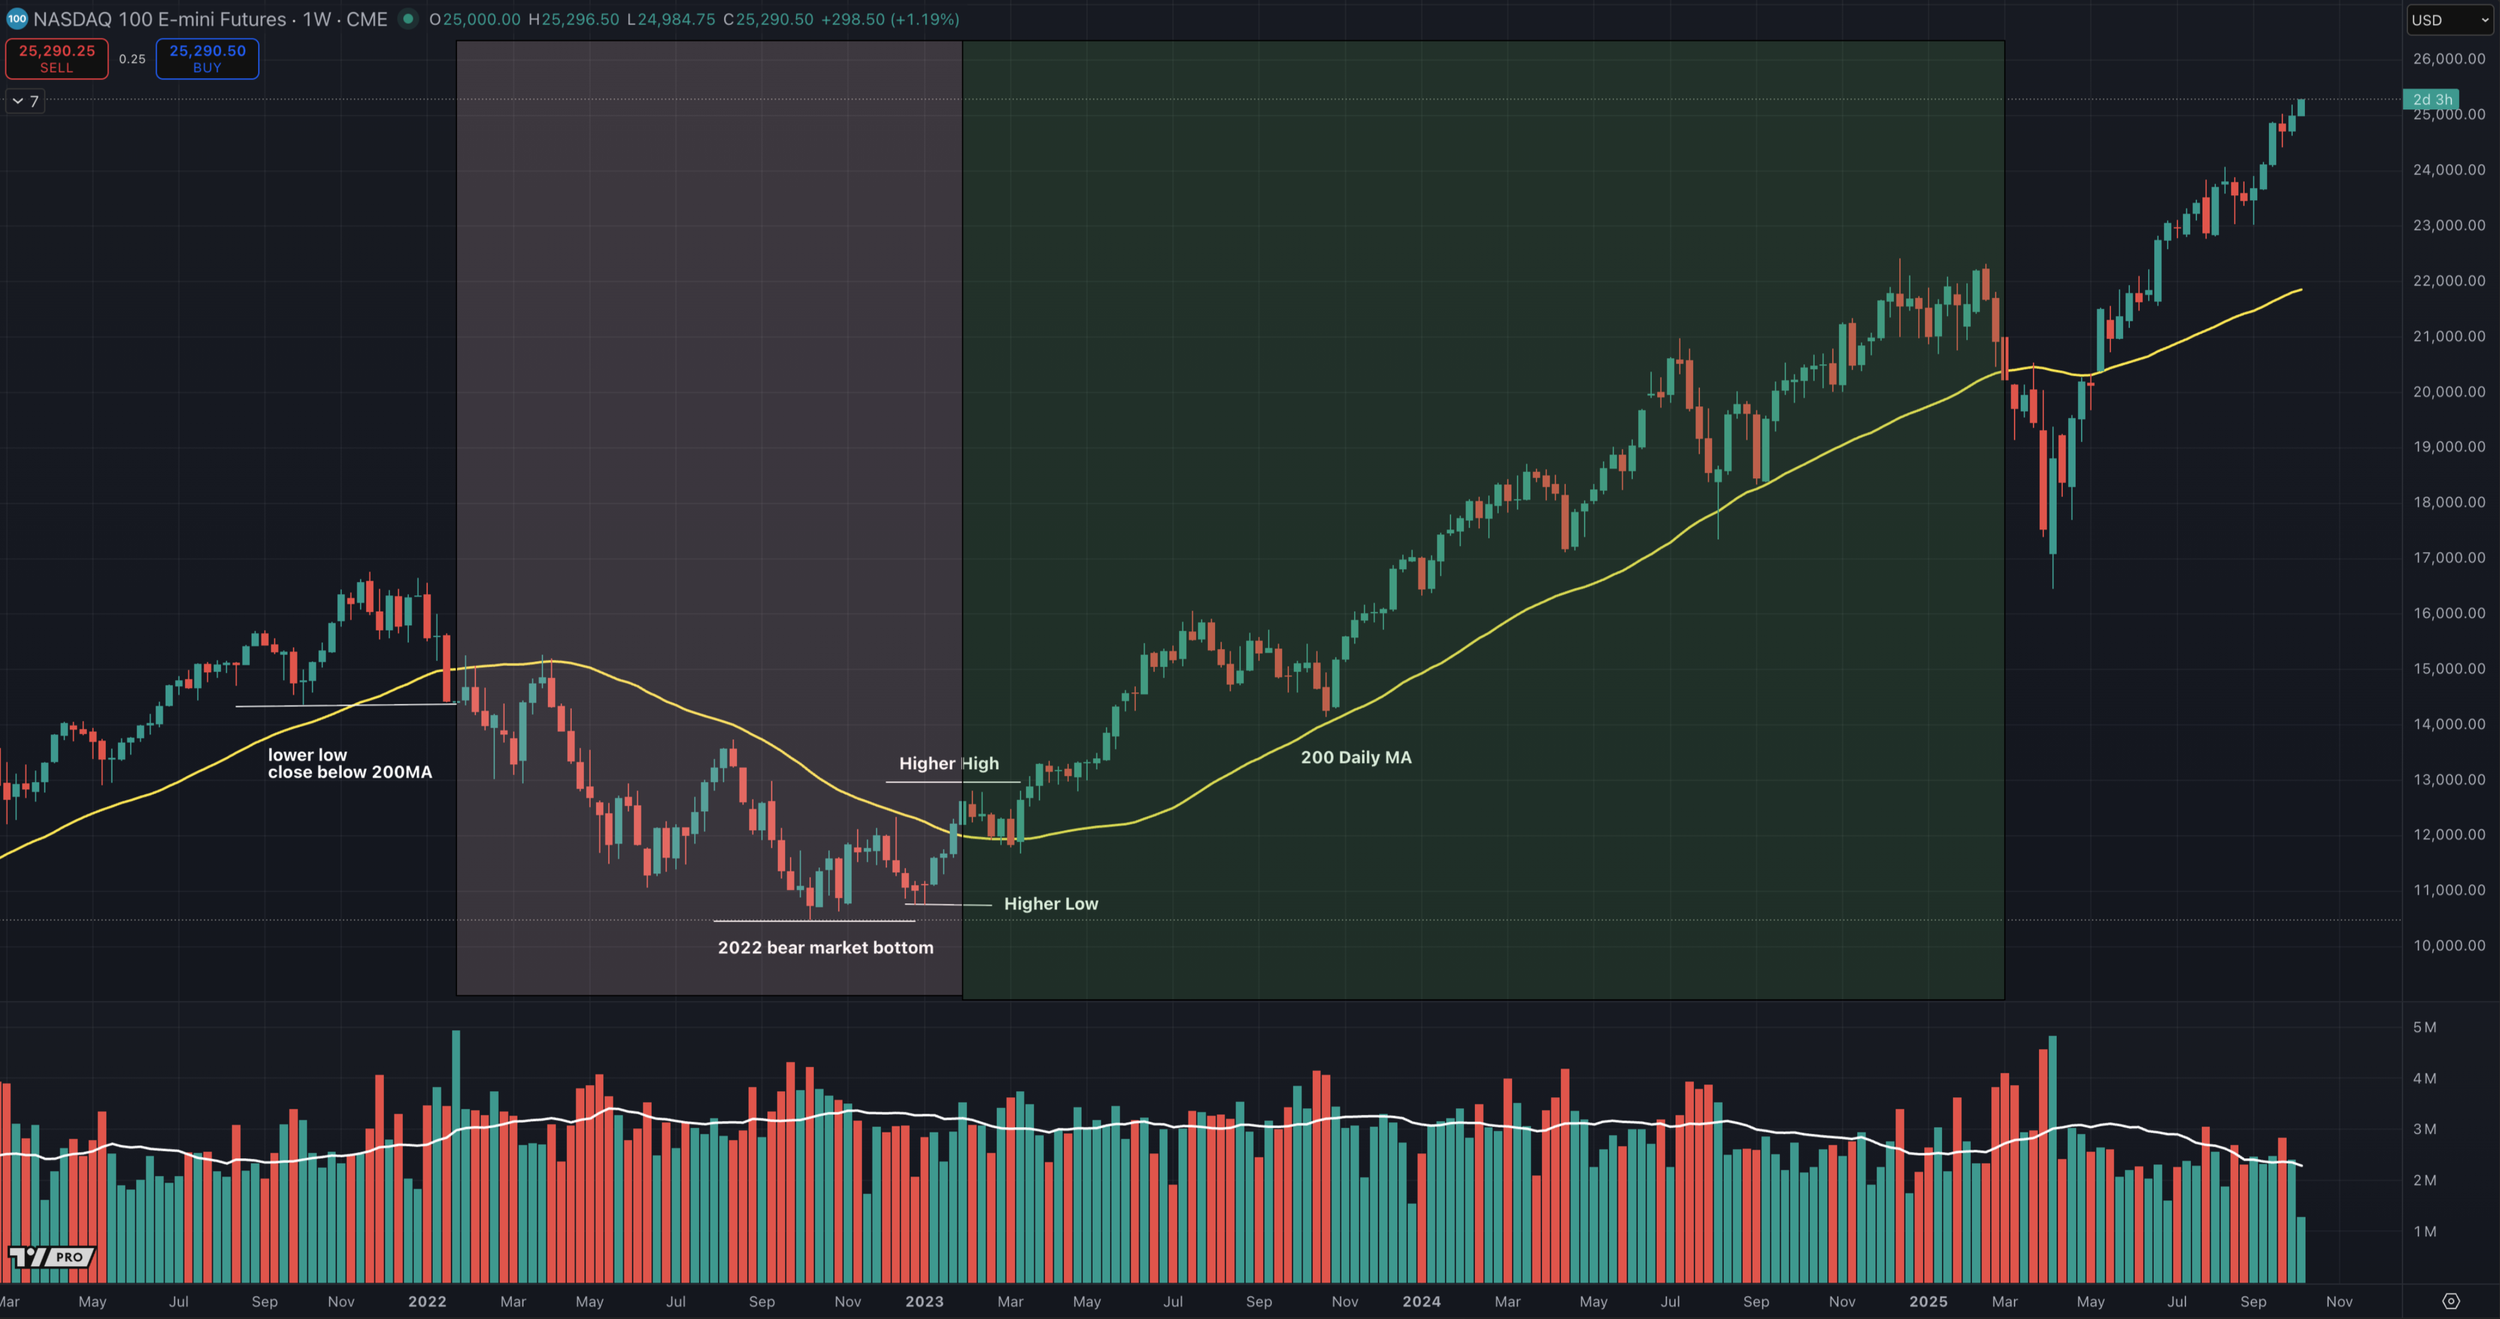
The 2022 bear market looked identical.
A lower low and close below the 200 SMA on high volume marked the danger zone.
When the Nasdaq made its first higher low and higher high in January 2023, along with a breakout above the 200 SMA, that was your “character change” and confirmation that a new bull phase was starting.
History doesn’t repeat perfectly, but it definitely rhymes.
The 2020 V-Shape Recovery — When Structure Snaps Back
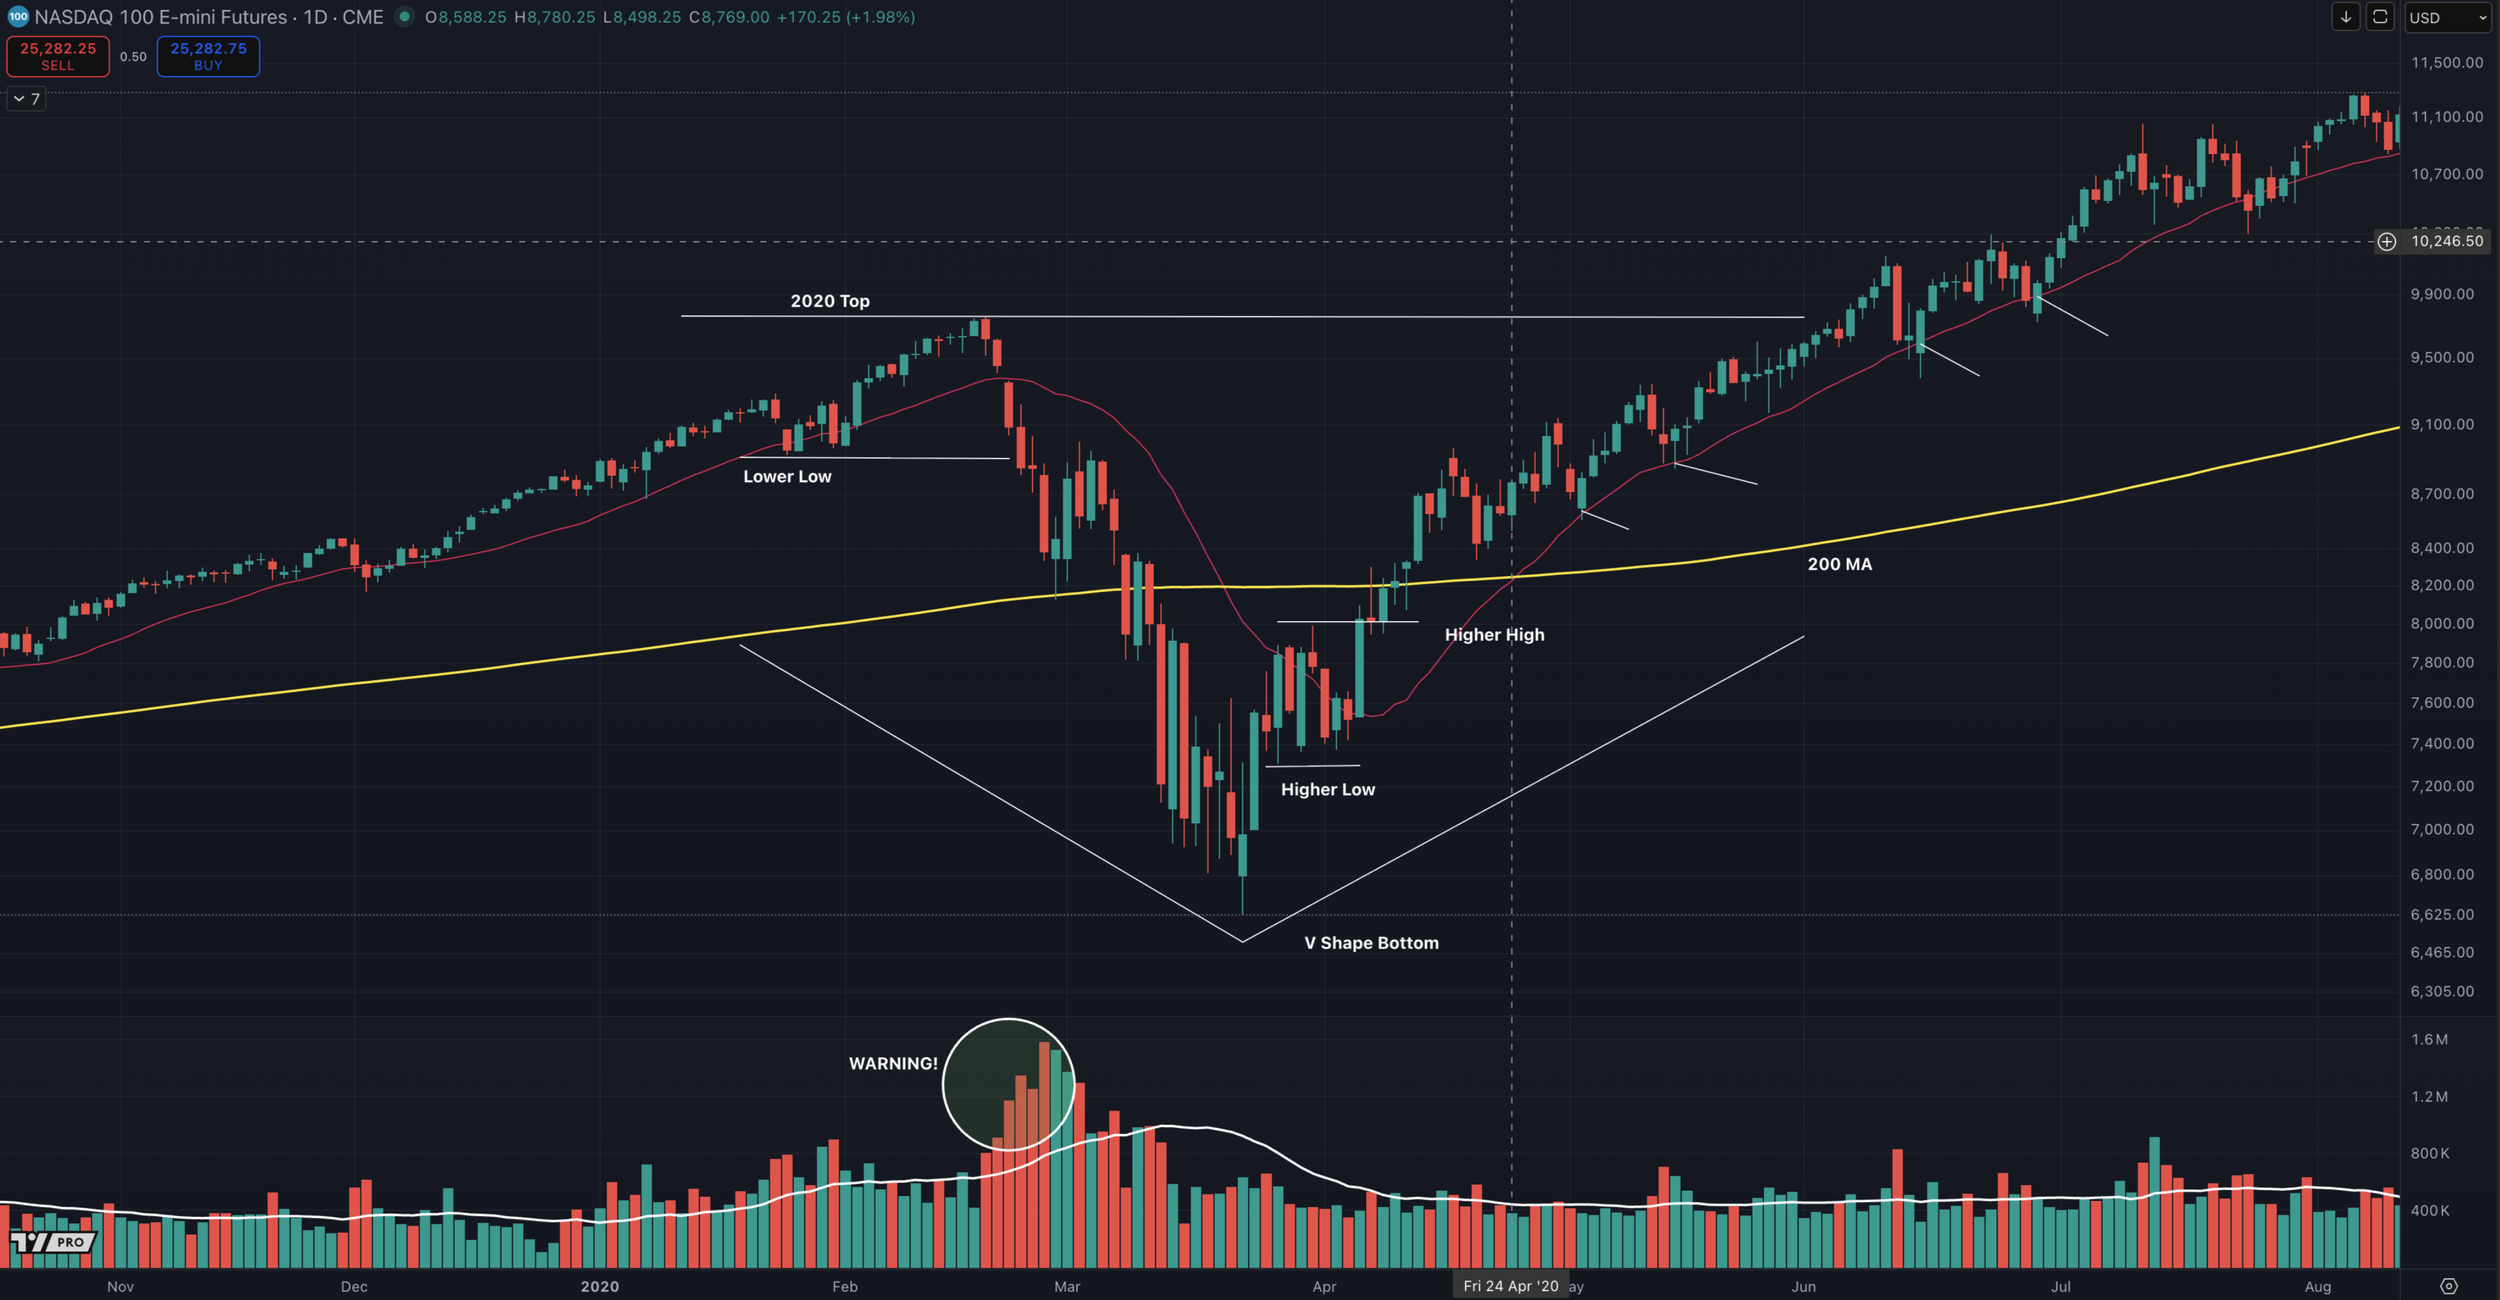
The 2020 COVID crash broke every record and rebounded faster than any bear market in history. In V-shaped recoveries, the market doesn’t always form a clean higher low before taking off.
Instead:
Drop to a lower timeframe to spot the higher-high / higher-low pattern earlier.
Or use a breakout candle entry (buying the first higher-high candle) with your stop at the prior low.
Alternatively, wait for a pullback into a respected moving average; in 2020, the 20-day MA acted as powerful support once the market reclaimed it.
Even in extreme recoveries, the same principles apply: trend alignment and moving average confirmation.
The 2025 Tariff Scare — A Mini V-Shape Correction

While not a full bear market, the 2025 Tariff Scare followed the same market structure blueprint seen in larger corrections. After making a lower high and lower low on rising volume, the Nasdaq broke briefly below its 200-day moving average, shaking out weak hands. Just like every other panic low, the recovery started with a higher low, followed by a higher high: a clear sign that buyers had regained control.
This move underscored the same lesson as 2020:
The pattern of fear and recovery repeats, just in different magnitudes.
Not every pullback becomes a bear market, but every bottom, big or small, follows the same character change. Recognizing that structure early helps you stay objective when everyone else reacts emotionally.

Volume — The Market’s Truth Serum
Volume tells you what price alone can’t:
Big red spikes: Distribution, institutions are exiting.
Big green spikes: Accumulation, smart money returning.
Before every major top, volume expands on declines.
Before every lasting recovery, volume expands on rallies.
Ignore the noise. The tape doesn’t lie.
While volume shows where the institutions are active, the behavior of leading stocks confirms it.
Leading Stocks Tell the Truth First
Another key indicator of a primary change in market direction, after the signals from daily moving averages, is the behavior of leading stocks.
After the market has advanced for a couple of years, you can be fairly sure it’s headed for trouble when the true market leaders start acting abnormally. They stop making new highs, start breaking key support levels on heavy volume, or fail to follow through on breakouts.
When leadership begins to thin out, and fewer names are driving the index higher, that’s an early warning that institutional demand is fading. Just like the indexes themselves, leading stocks signal trouble before the averages do.
Signs of Abnormal Activity
One major red flag is what William O’Neil called a “climax top.”
This happens when leading stocks go parabolic, accelerating sharply after a long advance, often on huge volume and wide, loose price swings. These aren’t signs of strength; they’re exhaustion moves.
You’ll also notice that many bases become wide and erratic, another big sign of instability and hidden distribution under the surface.
Some leaders may appear to buck the trend at first, holding up while the broader market weakens, but eventually the selling pressure catches up; the market always pulls them down.
And finally, when the original leaders begin to falter and money starts flowing into lower-priced, lower-quality, more speculative stocks, that’s your final warning.
Laggards can’t lead a market higher.
The Most Personal Warning Sign
The last and most personal indicator comes from your own results:
How are your recent buys doing?
When most of your recent positions aren’t working, breakouts are failing, or follow-throughs are weak, that’s the market telling you something has changed.
Even if the indexes still look fine on the surface, your own portfolio’s feedback is often the earliest and most honest signal that the environment is shifting from favorable to dangerous.
Listen to it, the market speaks through your own trades.
Watch for Stocks That Hold Up in Bear Markets
While most investors focus on the indexes, the real clues about the next bull market often come from individual stocks that refuse to break down during bear markets.
When a stock shows relative strength, holding up well while the market falls, it’s worth paying attention.
If it’s not a defensive “safety” name (like consumer staples or utilities) but instead from a growth or leadership industry, that stock can often emerge as a future leader in the next bull phase.
A perfect example is Super Micro Computer (SMCI) during the 2022 bear market.
The Nasdaq-100 topped in November 2021 and bottomed in October 2022, declining roughly 37%.
During that same period, SMCI only fell 19%, and more importantly, it built a base instead of collapsing.
SMCI made its low in April 2022 and began rising while the bear market was still ongoing.
By July and October 2022, it had already established two higher lows and two higher highs with a rising 200-day moving average.

That quiet show of strength was the early clue. As the new bull market took hold, SMCI exploded 1,800% from October 2023 to March 2024, becoming one of the leading stocks of the cycle.
💡 Lesson: Stocks that hold up best during bear markets often become the next cycle’s biggest winners.
How to Trade the Transitions
A few simple rules can keep you on the right side of the market:
The 200-Day SMA = Your Risk Line
Above = offense.
Below = defense.Structure Defines Trend
Higher high + higher low = Uptrend.
Lower high + lower low = Downtrend.
Volume Confirms the Story
Rising volume on declines = distribution.
Rising volume on rallies = accumulation.Adapt to the Market’s Character
Markets can bottom sharply (V-shape) or gradually (base building).
Recognize which environment you’re in, and trade accordingly.
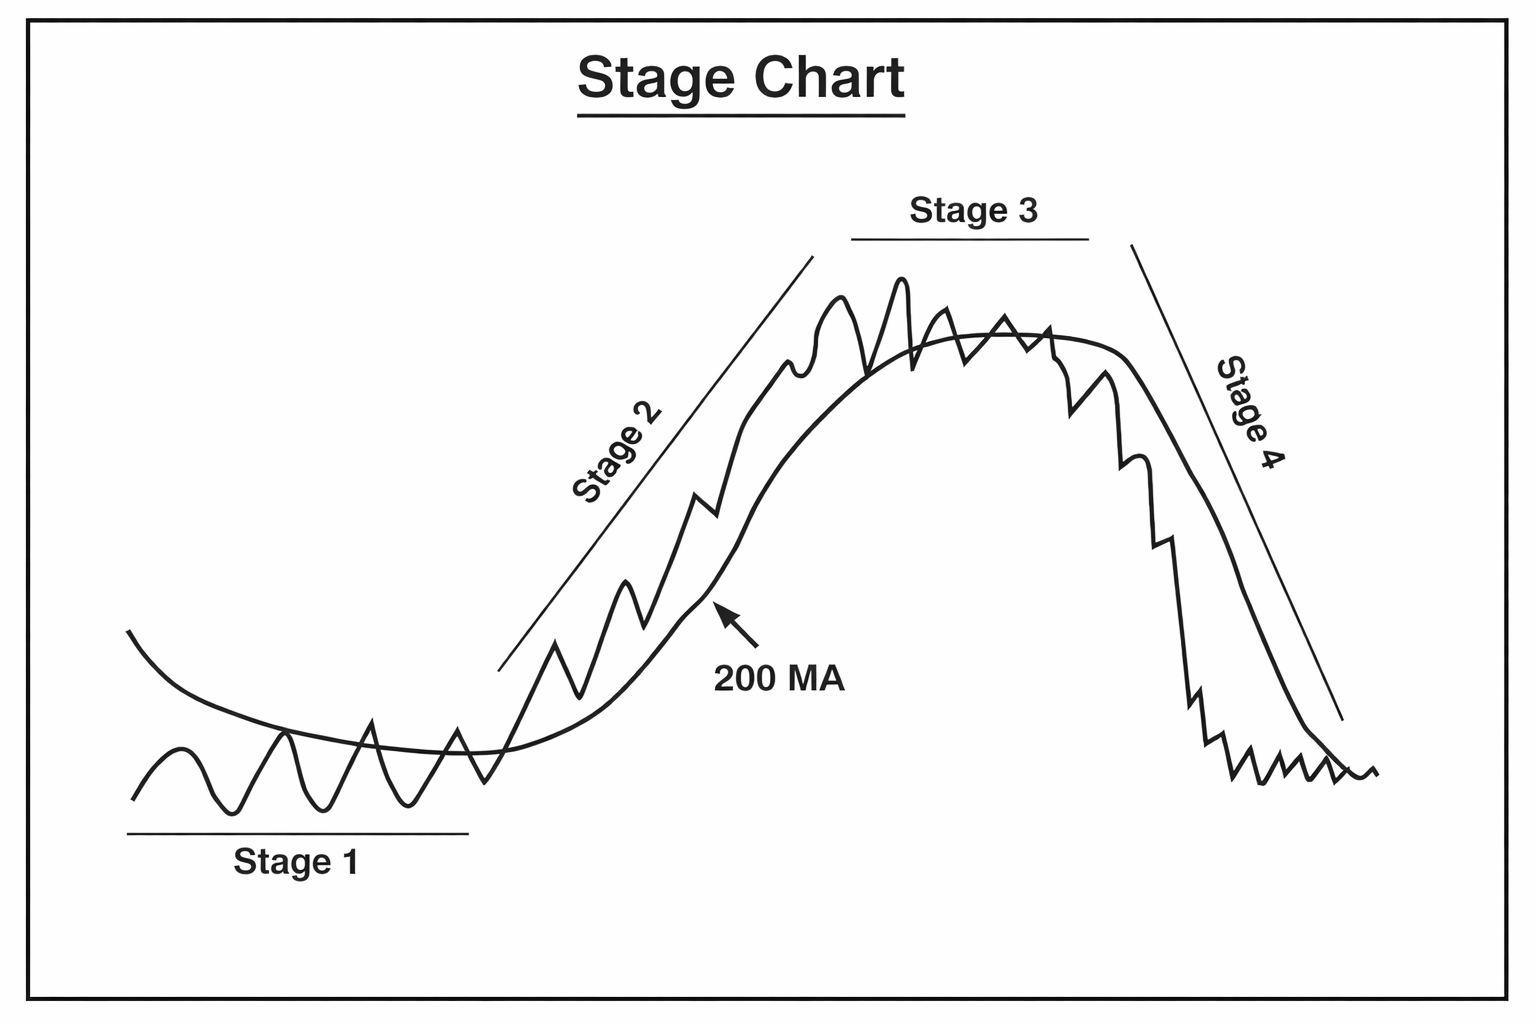
The Four Stages of Every Market

Market stages help define when to be aggressive, when to be cautious, and when to protect capital. Stage 1 is where accumulation begins and leadership may start to improve, but the strategy is still to watch, prepare, and build a focused watchlist. The real opportunity comes in Stage 2, when price confirms strength by moving above key moving averages, forming higher highs and higher lows, and attracting volume on rallies. That is where we look to enter, add, and hold winning positions. Stage 3 is where momentum starts to weaken, distribution appears, and the market begins showing signs of topping. This does not always mean moving fully to cash, but it does mean trimming weaker positions, reducing exposure, and becoming more selective. Stage 4 is the danger zone, where the trend is broken, selling pressure is heavy, and capital preservation becomes the priority. In this stage, the focus shifts to cash, defense, or shorting when appropriate.
The Bottom Line
The market never changes its language, only the players do.
Each major cycle gives the same technical warnings:
A shift in structure
A break of trend
A change in volume behavior
A relationship shift with key moving averages
If you understand those signals, you’ll never have to “guess” where we are again.
You’ll be able to protect your capital in downturns, and position early when the next bull market begins.
📚 Recommended Reading
Secrets for Profiting in Bull and Bear Markets — Stan Weinstein
How to Make Money in Stocks — William J. O’Neil
Technical Analysis Using Multiple Timeframes — Brian Shannon
Want to Go Deeper?
If you found this helpful and want to go deeper, consider taking the Momentum Trading Strategy Course.
Inside the course, I walk through the complete framework behind growth stock and momentum trading, including market timing, stock selection, entries, exits, risk management, position sizing, trade review, and building a repeatable process.
This post gives you one piece of the puzzle. The course gives you the complete foundation for applying a full trading and investing process.